Estimated Value: $270,061 - $338,000
3
Beds
3
Baths
2,225
Sq Ft
$134/Sq Ft
Est. Value
About This Home
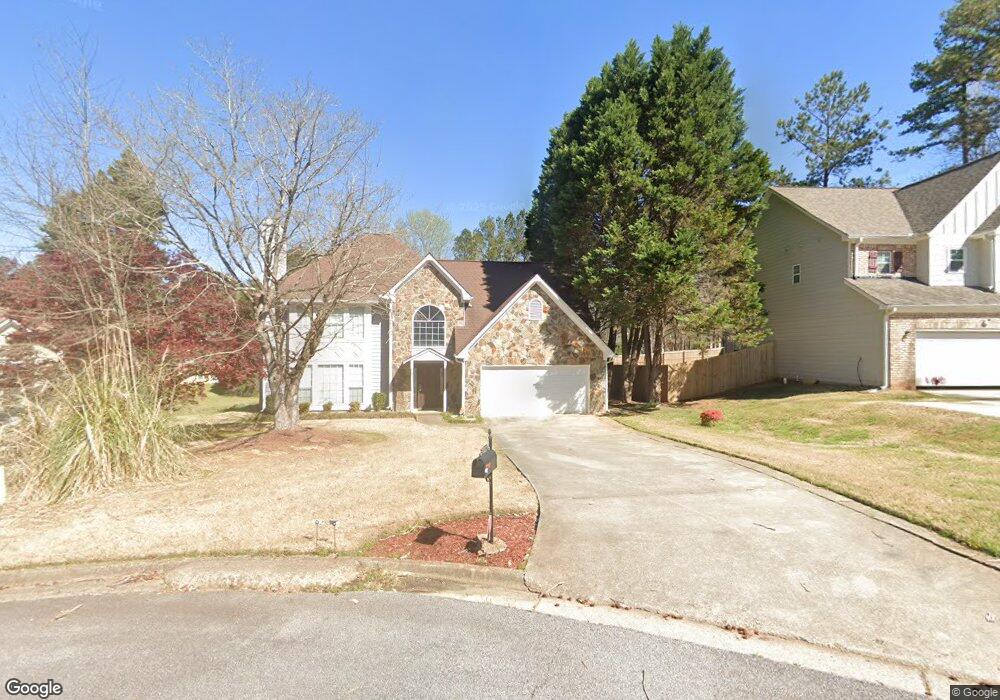
This home is located at 3270 Sommerset Ct Unit III, Rex, GA 30273 and is currently estimated at $298,265, approximately $134 per square foot. 3270 Sommerset Ct Unit III is a home located in Clayton County with nearby schools including Roberta T. Smith Elementary School, Rex Mill Middle School, and Mount Zion High School.
Ownership History
Date
Name
Owned For
Owner Type
Purchase Details
Closed on
May 8, 2002
Sold by
Olatunji Ayobami A
Bought by
Olatunji Aobami A and Olatunji Olayinka O
Current Estimated Value
Purchase Details
Closed on
May 25, 2000
Sold by
Gibbons James C and Gibbons Cynthia A
Bought by
Olatunji Ayobami A
Home Financials for this Owner
Home Financials are based on the most recent Mortgage that was taken out on this home.
Original Mortgage
$136,325
Interest Rate
7.88%
Mortgage Type
New Conventional
Purchase Details
Closed on
Sep 29, 1995
Sold by
Martin Homes
Bought by
Gibbons James C Cynthia A
Create a Home Valuation Report for This Property
The Home Valuation Report is an in-depth analysis detailing your home's value as well as a comparison with similar homes in the area
Home Values in the Area
Average Home Value in this Area
Purchase History
| Date | Buyer | Sale Price | Title Company |
|---|---|---|---|
| Olatunji Aobami A | -- | -- | |
| Olatunji Ayobami A | $143,500 | -- | |
| Gibbons James C Cynthia A | $118,900 | -- |
Source: Public Records
Mortgage History
| Date | Status | Borrower | Loan Amount |
|---|---|---|---|
| Previous Owner | Olatunji Ayobami A | $136,325 | |
| Closed | Gibbons James C Cynthia A | $0 |
Source: Public Records
Tax History Compared to Growth
Tax History
| Year | Tax Paid | Tax Assessment Tax Assessment Total Assessment is a certain percentage of the fair market value that is determined by local assessors to be the total taxable value of land and additions on the property. | Land | Improvement |
|---|---|---|---|---|
| 2024 | $3,571 | $100,640 | $8,000 | $92,640 |
| 2023 | $3,478 | $96,320 | $8,000 | $88,320 |
| 2022 | $2,850 | $81,720 | $8,000 | $73,720 |
| 2021 | $2,043 | $60,840 | $8,000 | $52,840 |
| 2020 | $2,296 | $66,529 | $8,000 | $58,529 |
| 2019 | $2,024 | $58,995 | $7,200 | $51,795 |
| 2018 | $1,791 | $53,257 | $7,200 | $46,057 |
| 2017 | $1,608 | $48,666 | $7,200 | $41,466 |
| 2016 | $1,370 | $42,818 | $7,200 | $35,618 |
| 2015 | $1,128 | $0 | $0 | $0 |
| 2014 | $608 | $24,380 | $7,200 | $17,180 |
Source: Public Records
Map
Nearby Homes
- 3189 Glen Hollow Dr
- 3145 Deerfield Way
- 3140 Glen Hollow Dr
- 7101 Hazelwood Dr Unit 8
- 3401 Mosswood Ln
- 7074 Babbling Brook Dr
- 3168 Rock Creek Dr
- 3552 Topaz Terrace
- 3087 Drexel Ln
- 6921 Babbling Brook Dr
- 7106 Oakwood Cir Unit 1
- 3353 Medina Dr
- 3193 Medina Dr
- 7166 Thunder Ridge
- 6968 Fielder Rd
- 3085 Ashbury Ln Unit 8
- 3315 Canterbury Trail
- 6891 Dresden Dr
- 3274 Sommerset Ct
- 3266 Sommerset Ct
- 0 Sommerset Ct Unit 8438489
- 0 Sommerset Ct Unit 7277655
- 3263 Weathered Wood Way
- 6942 Wood Creek Ln
- 3263 Sommerset Ct
- 6938 Wood Creek Ln
- 6946 Wood Creek Ln
- 3259 Weathered Wood Way Unit III
- 3267 Sommerset Ct Unit 3
- 3267 Sommerset Ct
- 3281 Rock Creek Dr
- 6950 Wood Creek Ln Unit 2
- 3268 Weathered Wood Way Unit III
- 3279 Weathered Wood Way
- 3255 Weathered Wood Way
- 3623 Sommerset Ct
- 3260 Weathered Wood Way
- 3273 Rock Creek Dr