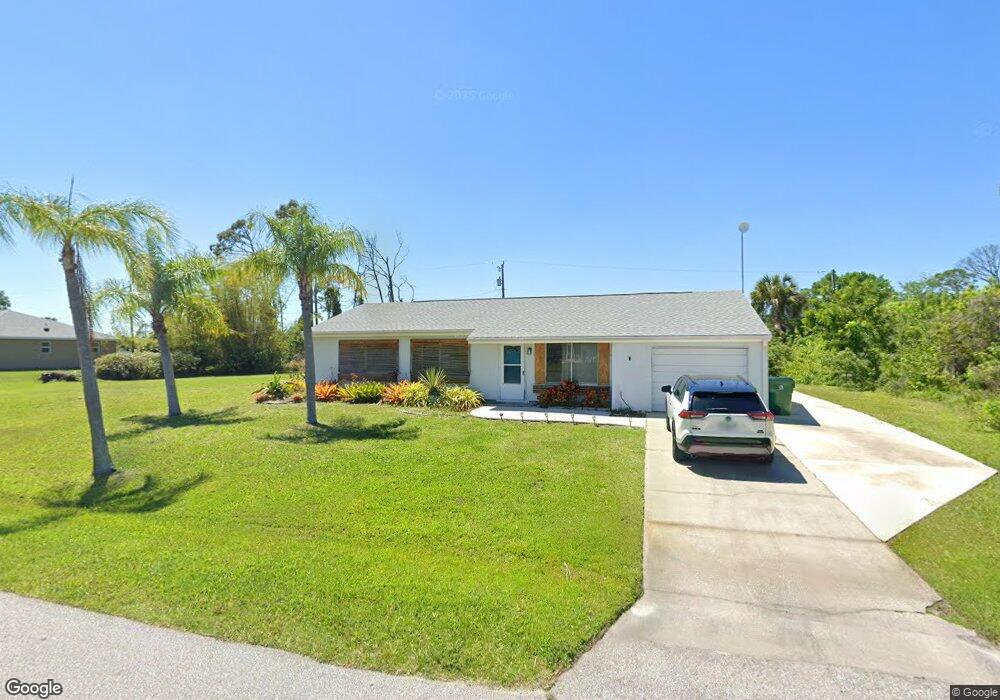
3271 Holcomb Rd Port Charlotte, FL 33981
Gulf Cove NeighborhoodEstimated Value: $227,000 - $303,000
3
Beds
2
Baths
1,176
Sq Ft
$219/Sq Ft
Est. Value
About This Home
This home is located at 3271 Holcomb Rd, Port Charlotte, FL 33981 and is currently estimated at $257,907, approximately $219 per square foot. 3271 Holcomb Rd is a home located in Charlotte County with nearby schools including Myakka River Elementary School, L.A. Ainger Middle School, and Lemon Bay High School.
Ownership History
Date
Name
Owned For
Owner Type
Purchase Details
Closed on
Sep 27, 2022
Sold by
Keeton Joe N and Keeton Doris B
Bought by
Keeton Doris B and Keeton Joe N
Current Estimated Value
Purchase Details
Closed on
May 3, 2016
Sold by
Weese Christopher H
Bought by
Keeton Joe N and Keeton Doris B
Home Financials for this Owner
Home Financials are based on the most recent Mortgage that was taken out on this home.
Original Mortgage
$96,000
Interest Rate
3.59%
Mortgage Type
New Conventional
Purchase Details
Closed on
Jul 27, 2010
Sold by
Halcomb Philip D
Bought by
Weese Christopher J
Home Financials for this Owner
Home Financials are based on the most recent Mortgage that was taken out on this home.
Original Mortgage
$95,711
Interest Rate
5.12%
Mortgage Type
FHA
Purchase Details
Closed on
Mar 4, 1998
Sold by
Thompson Judith K
Bought by
Thompson Judith K
Purchase Details
Closed on
Oct 13, 1995
Sold by
Thompson Bartley J and Thompson Judith K
Bought by
Thompson Judith K
Create a Home Valuation Report for This Property
The Home Valuation Report is an in-depth analysis detailing your home's value as well as a comparison with similar homes in the area
Home Values in the Area
Average Home Value in this Area
Purchase History
| Date | Buyer | Sale Price | Title Company |
|---|---|---|---|
| Keeton Doris B | $100 | -- | |
| Keeton Joe N | $120,000 | Coastal Security Title, Inc | |
| Weese Christopher J | $97,000 | Coastal Security Title Inc | |
| Thompson Judith K | -- | -- | |
| Thompson Judith K | -- | -- |
Source: Public Records
Mortgage History
| Date | Status | Borrower | Loan Amount |
|---|---|---|---|
| Previous Owner | Keeton Joe N | $96,000 | |
| Previous Owner | Weese Christopher J | $95,711 |
Source: Public Records
Tax History Compared to Growth
Tax History
| Year | Tax Paid | Tax Assessment Tax Assessment Total Assessment is a certain percentage of the fair market value that is determined by local assessors to be the total taxable value of land and additions on the property. | Land | Improvement |
|---|---|---|---|---|
| 2023 | $2,458 | $107,808 | $0 | $0 |
| 2022 | $2,281 | $108,701 | $14,025 | $94,676 |
| 2021 | $2,114 | $89,097 | $6,248 | $82,849 |
| 2020 | $2,152 | $90,824 | $6,248 | $84,576 |
| 2019 | $2,136 | $92,468 | $6,248 | $86,220 |
| 2018 | $1,985 | $90,698 | $5,950 | $84,748 |
| 2017 | $1,917 | $85,564 | $5,780 | $79,784 |
| 2016 | $1,885 | $68,471 | $0 | $0 |
| 2015 | $1,708 | $62,246 | $0 | $0 |
| 2014 | $1,485 | $56,587 | $0 | $0 |
Source: Public Records
Map
Nearby Homes
- 3272 & 3280 Holcomb Rd
- 3236 Gillot Blvd
- 3229 Gillot Blvd
- 3318 El Salvador Rd
- 12340 Cole Ave
- 12387 Minot Ave
- 3164 Montgomery Dr
- 3455 Montgomery Dr
- 3116 Montgomery Dr
- 3084 Montgomery Dr
- 12374 Quinlan Ave
- 12430 Quinlan Ave
- 12245 Quinlan Ave
- 12420 Minot Ave
- 12198 Quinlan Ave
- 12197 Cochran Ave
- 3457 El Salvador Rd
- 12172 Kilmer Ave
- 3077 Stone St
- 12163 Kilmer Ave
- 3348 Holcomb Rd
- 3098 Holcomb Rd
- 3263 Holcomb Rd
- 3255 Holcomb Rd
- 3349 Holcomb Rd
- 3223 and 3240 Holcomb Rd
- 3239 & 3247 Holcomb Rd
- 3231 & 3239 & 3247 Holcomb Rd
- 3420 Holcomb Rd
- 3287 Holcomb Rd
- 3284 Montgomery Dr
- 3280 Holcomb Rd
- 3256 Holcomb Rd
- 12347 Minot Ave
- 3295 Holcomb Rd
- 3294 Montgomery Dr
- 3296 Holcomb Rd
- 3244 Montgomery Dr
- 12348 Minot Ave
- 12355 Avenue