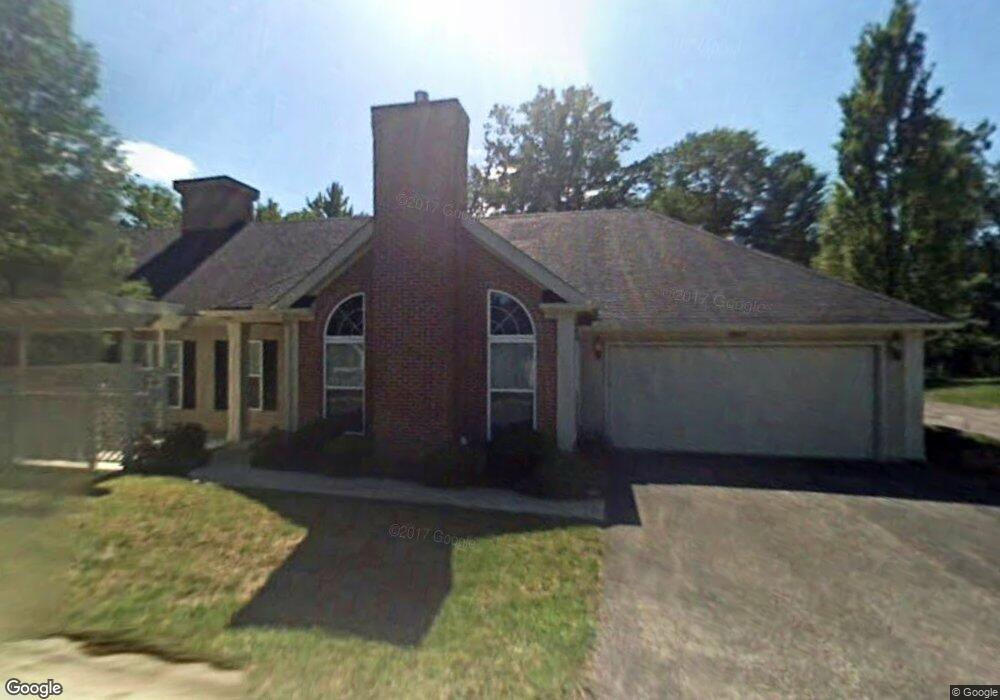
3271 Orchard Way Westlake, OH 44145
Estimated Value: $245,000 - $253,000
2
Beds
2
Baths
1,277
Sq Ft
$194/Sq Ft
Est. Value
About This Home
This home is located at 3271 Orchard Way, Westlake, OH 44145 and is currently estimated at $247,995, approximately $194 per square foot. 3271 Orchard Way is a home located in Cuyahoga County with nearby schools including Dover Intermediate School, Lee Burneson Middle School, and Westlake High School.
Ownership History
Date
Name
Owned For
Owner Type
Purchase Details
Closed on
Feb 25, 2004
Sold by
Hazzard Cynthia A
Bought by
Hazzard Cynthia A and Pompei Theodore
Current Estimated Value
Home Financials for this Owner
Home Financials are based on the most recent Mortgage that was taken out on this home.
Original Mortgage
$185,000
Outstanding Balance
$58,162
Interest Rate
1%
Mortgage Type
Unknown
Estimated Equity
$189,833
Purchase Details
Closed on
Sep 8, 1998
Sold by
Kopf Construction Corp
Bought by
Foley Lee B and Foley Kathleen A
Home Financials for this Owner
Home Financials are based on the most recent Mortgage that was taken out on this home.
Original Mortgage
$143,800
Interest Rate
6.99%
Create a Home Valuation Report for This Property
The Home Valuation Report is an in-depth analysis detailing your home's value as well as a comparison with similar homes in the area
Home Values in the Area
Average Home Value in this Area
Purchase History
| Date | Buyer | Sale Price | Title Company |
|---|---|---|---|
| Hazzard Cynthia A | -- | Chicago Title Insurance Co | |
| Hazzard Cynthia A | $167,000 | Chicago Title Insurance Co | |
| Foley Lee B | $159,800 | -- |
Source: Public Records
Mortgage History
| Date | Status | Borrower | Loan Amount |
|---|---|---|---|
| Open | Hazzard Cynthia A | $185,000 | |
| Previous Owner | Foley Lee B | $143,800 | |
| Closed | Hazzard Cynthia A | $65,200 |
Source: Public Records
Tax History Compared to Growth
Tax History
| Year | Tax Paid | Tax Assessment Tax Assessment Total Assessment is a certain percentage of the fair market value that is determined by local assessors to be the total taxable value of land and additions on the property. | Land | Improvement |
|---|---|---|---|---|
| 2024 | $3,792 | $80,045 | $8,015 | $72,030 |
| 2023 | $3,324 | $59,990 | $6,020 | $53,970 |
| 2022 | $3,271 | $59,990 | $6,020 | $53,970 |
| 2021 | $3,275 | $59,990 | $6,020 | $53,970 |
| 2020 | $2,789 | $46,870 | $4,690 | $42,180 |
| 2019 | $2,705 | $133,900 | $13,400 | $120,500 |
| 2018 | $2,625 | $46,870 | $4,690 | $42,180 |
| 2017 | $2,561 | $41,550 | $4,450 | $37,100 |
| 2016 | $2,547 | $41,550 | $4,450 | $37,100 |
| 2015 | $2,850 | $41,550 | $4,450 | $37,100 |
| 2014 | $2,850 | $45,640 | $4,900 | $40,740 |
Source: Public Records
Map
Nearby Homes
- 3263 Bay Landing Dr Unit 27
- 2995 N Bay Dr Unit I14
- 3247 Bay Landing Dr Unit 31
- 2897 N Bay Dr Unit M4
- 2820 N Bay Dr
- 3115 Bay Landing Dr Unit 3115
- 26814 Center Ridge Rd
- 28080 Center Ridge Rd
- 27120 Rose Rd
- 28340 Center Ridge Rd Unit 123
- 3107 Clark Pkwy
- 28276 Hallberg Dr
- 28282 Hallberg Dr
- 28264 Hallberg Dr
- 3450 Briar Ridge Ct Unit F
- #1 Fifth Ave
- 3781 Dover Center Rd
- 3732 Greenbriar Cir
- 2965 Creekside Dr
- 29053 W Brockway Dr
- 3259 Orchard Way
- 3272 Orchard Way
- 3268 Orchard Way
- 3283 Orchard Way
- 3242 Orchard Way Unit 3242
- 3234 Orchard Way
- 3238 Orchard Way
- 3238 Orchard Way Unit 3238
- 3295 Orchard Way
- 3299 Orchard Way Unit 3299
- 3230 Orchard Way
- 3230 Orchard Way Unit 3230
- 3237 Village Green Dr
- 3251 Orchard Way
- 3247 Orchard Way
- 3231 Orchard Way
- 3235 Orchard Way
- 3290 Orchard Way Unit 18
- 3233 Village Green Dr Unit 18
- 3286 Orchard Way