Estimated Value: $247,168 - $290,000
3
Beds
2
Baths
1,816
Sq Ft
$151/Sq Ft
Est. Value
About This Home
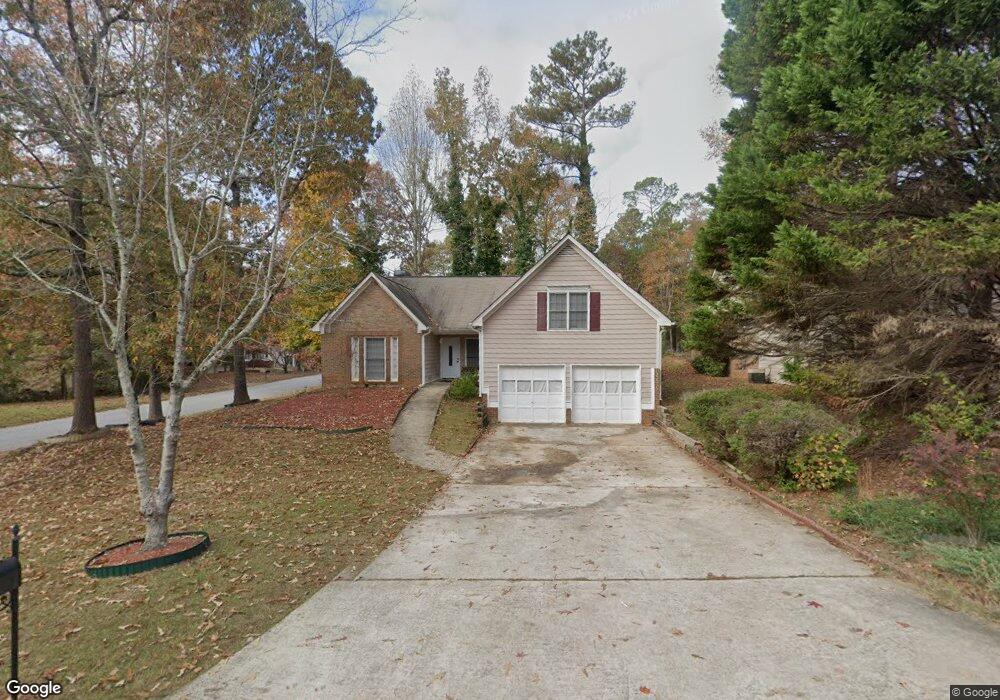
This home is located at 3271 Poplar Ridge Dr, Rex, GA 30273 and is currently estimated at $274,542, approximately $151 per square foot. 3271 Poplar Ridge Dr is a home located in Clayton County with nearby schools including Roberta T. Smith Elementary School, Rex Mill Middle School, and Mount Zion High School.
Ownership History
Date
Name
Owned For
Owner Type
Purchase Details
Closed on
Feb 4, 2011
Sold by
Herrera Claudia G L
Bought by
Ocola Fausto E
Current Estimated Value
Home Financials for this Owner
Home Financials are based on the most recent Mortgage that was taken out on this home.
Original Mortgage
$76,500
Outstanding Balance
$2,953
Interest Rate
4.82%
Mortgage Type
Trade
Estimated Equity
$271,589
Purchase Details
Closed on
Jan 25, 2010
Sold by
Hud-Housing Of Urban Dev
Bought by
Herrera Claudia G L
Purchase Details
Closed on
Apr 7, 2009
Sold by
Citimortgage Inc
Bought by
Hud-Housing Of Urban Dev
Purchase Details
Closed on
Jun 19, 2003
Sold by
Regulus Edward L and Regulus Lizzie E
Bought by
Tyner Mark T
Home Financials for this Owner
Home Financials are based on the most recent Mortgage that was taken out on this home.
Original Mortgage
$136,800
Interest Rate
5.29%
Mortgage Type
FHA
Create a Home Valuation Report for This Property
The Home Valuation Report is an in-depth analysis detailing your home's value as well as a comparison with similar homes in the area
Home Values in the Area
Average Home Value in this Area
Purchase History
| Date | Buyer | Sale Price | Title Company |
|---|---|---|---|
| Ocola Fausto E | $85,000 | -- | |
| Herrera Claudia G L | -- | -- | |
| Hud-Housing Of Urban Dev | -- | -- | |
| Citimortgage Inc | $135,969 | -- | |
| Tyner Mark T | $141,900 | -- |
Source: Public Records
Mortgage History
| Date | Status | Borrower | Loan Amount |
|---|---|---|---|
| Open | Ocola Fausto E | $76,500 | |
| Previous Owner | Tyner Mark T | $136,800 |
Source: Public Records
Tax History Compared to Growth
Tax History
| Year | Tax Paid | Tax Assessment Tax Assessment Total Assessment is a certain percentage of the fair market value that is determined by local assessors to be the total taxable value of land and additions on the property. | Land | Improvement |
|---|---|---|---|---|
| 2024 | $3,498 | $98,760 | $8,000 | $90,760 |
| 2023 | $2,440 | $94,600 | $8,000 | $86,600 |
| 2022 | $2,723 | $78,480 | $8,000 | $70,480 |
| 2021 | $2,011 | $60,040 | $8,000 | $52,040 |
| 2020 | $1,906 | $56,775 | $8,000 | $48,775 |
| 2019 | $2,080 | $50,386 | $7,200 | $43,186 |
| 2018 | $1,906 | $46,079 | $7,200 | $38,879 |
| 2017 | $1,662 | $39,992 | $7,200 | $32,792 |
| 2016 | $1,487 | $35,691 | $7,200 | $28,491 |
| 2015 | $1,287 | $0 | $0 | $0 |
| 2014 | $864 | $20,844 | $7,200 | $13,644 |
Source: Public Records
Map
Nearby Homes
- 3168 Rock Creek Dr
- 3315 Canterbury Trail
- 6722 Bent Creek Dr
- 3552 Topaz Terrace
- 6706 Bent Creek Dr
- 3217 Canterbury Trail
- 6708 Bedford Rd
- 3085 Ashbury Ln Unit 8
- 3145 Deerfield Way
- 3140 Glen Hollow Dr
- 6921 Babbling Brook Dr
- 3189 Glen Hollow Dr
- 3374 Creekwood Dr
- 3401 Mosswood Ln
- 6697 Cambridge Dr
- 7074 Babbling Brook Dr
- 6637 Bedford Rd Unit 2
- 6891 Dresden Dr
- 3267 Poplar Ridge Dr Unit III
- 3250 Wildflower Rd
- 3281 Poplar Ridge Dr
- 3251 Poplar Ridge Dr Unit 7
- 3274 Poplar Ridge Dr Unit 2
- 3251 Wildflower Rd
- 3242 Wildflower Rd Unit II
- 3270 Poplar Ridge Dr
- 0 Wildflower Rd Unit 3200258
- 0 Wildflower Rd Unit 3193261
- 3278 Poplar Ridge Dr
- 3239 Poplar Ridge Dr
- 3266 Poplar Ridge Dr
- 3285 Poplar Ridge Dr
- 3243 Wildflower Rd
- 3235 Poplar Ridge Dr
- 3282 Poplar Ridge Dr
- 805 Wildflower Cir
- 3262 Poplar Ridge Dr
- 3258 Poplar Ridge Dr