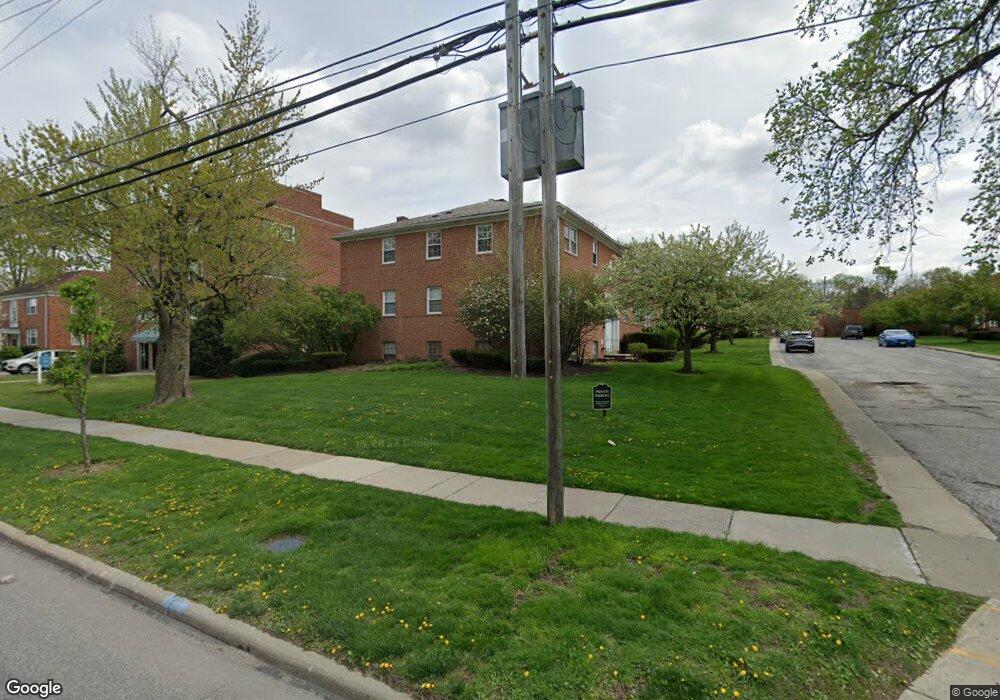
3271 Warrensville Center Rd Unit 9B Shaker Heights, OH 44122
Estimated Value: $61,000 - $83,000
2
Beds
2
Baths
984
Sq Ft
$74/Sq Ft
Est. Value
About This Home
This home is located at 3271 Warrensville Center Rd Unit 9B, Shaker Heights, OH 44122 and is currently estimated at $72,989, approximately $74 per square foot. 3271 Warrensville Center Rd Unit 9B is a home located in Cuyahoga County with nearby schools including Mercer Elementary School, Woodbury Elementary School, and Shaker Heights Middle School.
Ownership History
Date
Name
Owned For
Owner Type
Purchase Details
Closed on
Dec 19, 2008
Sold by
Third Federal Savings & Loan Association
Bought by
Holland Frederic
Current Estimated Value
Purchase Details
Closed on
Jul 27, 2007
Sold by
Miller Melissa
Bought by
Third Fsla Of Cleveland
Purchase Details
Closed on
Jan 29, 2004
Sold by
Partington Margaret Elizabeth Leunk
Bought by
Miller Melissa
Home Financials for this Owner
Home Financials are based on the most recent Mortgage that was taken out on this home.
Original Mortgage
$59,100
Interest Rate
5.91%
Mortgage Type
Purchase Money Mortgage
Purchase Details
Closed on
Jun 29, 1988
Sold by
Leunk Elizabeth M
Bought by
Partington Margaret E Leunk
Purchase Details
Closed on
Jun 1, 1978
Sold by
Stein Earl H and Schultz N M
Bought by
Leunk Elizabeth M
Purchase Details
Closed on
Jan 1, 1975
Bought by
Stein Earl H and Stein Schultz N
Create a Home Valuation Report for This Property
The Home Valuation Report is an in-depth analysis detailing your home's value as well as a comparison with similar homes in the area
Home Values in the Area
Average Home Value in this Area
Purchase History
| Date | Buyer | Sale Price | Title Company |
|---|---|---|---|
| Holland Frederic | $25,000 | Third Capital Title | |
| Third Fsla Of Cleveland | $40,687 | Attorneys Title Agency | |
| Miller Melissa | $61,000 | Chicago Title Insurance Comp | |
| Partington Margaret E Leunk | -- | -- | |
| Leunk Elizabeth M | $41,000 | -- | |
| Stein Earl H | -- | -- |
Source: Public Records
Mortgage History
| Date | Status | Borrower | Loan Amount |
|---|---|---|---|
| Previous Owner | Miller Melissa | $59,100 |
Source: Public Records
Tax History Compared to Growth
Tax History
| Year | Tax Paid | Tax Assessment Tax Assessment Total Assessment is a certain percentage of the fair market value that is determined by local assessors to be the total taxable value of land and additions on the property. | Land | Improvement |
|---|---|---|---|---|
| 2024 | $1,253 | $14,175 | $1,435 | $12,740 |
| 2023 | $1,148 | $10,290 | $980 | $9,310 |
| 2022 | $1,114 | $10,290 | $980 | $9,310 |
| 2021 | $1,110 | $10,290 | $980 | $9,310 |
| 2020 | $1,183 | $10,290 | $980 | $9,310 |
| 2019 | $1,166 | $29,400 | $2,800 | $26,600 |
| 2018 | $1,363 | $10,290 | $980 | $9,310 |
| 2017 | $1,625 | $13,580 | $1,330 | $12,250 |
| 2016 | $1,555 | $13,580 | $1,330 | $12,250 |
| 2015 | $2,884 | $13,580 | $1,330 | $12,250 |
| 2014 | $3,108 | $16,980 | $1,680 | $15,300 |
Source: Public Records
Map
Nearby Homes
- 3279 Warrensville Center Rd Unit 3 A
- 3279 Warrensville Center Rd Unit 15D
- 3180 Somerset Dr
- 3133 Somerset Dr
- 20975 Farnsleigh Rd
- 19901 Van Aken Blvd Unit C-106
- 19901 Van Aken Blvd Unit 205C
- 19901 Van Aken Blvd Unit 7
- 20945 Halworth Rd
- 21262 S Woodland Rd
- 20930 Halworth Rd
- 20950 Halworth Rd
- 3148 Belvoir Blvd
- 19627 Winslow Rd
- 19436 Van Aken Blvd Unit 205
- 21510 Halburton Rd
- 19201 Van Aken Blvd Unit 211
- 19201 Van Aken Blvd Unit 114
- 19201 Van Aken Blvd Unit 510
- 19201 Van Aken Blvd Unit 513
- 3271 Warrensville Center Rd Unit 17D
- 3271 Warrensville Center Rd Unit 15D
- 3271 Warrensville Center Rd Unit 10C
- 3271 Warrensville Center Rd Unit 5A
- 3271 Warrensville Center Rd
- 3271 Warrensville Center Rd Unit 14C
- 3271 Warrensville Center Rd
- 3271 Warrensville Center Rd
- 3271 Warrensville Center Rd
- 3271 Warrensville Center Rd
- 3271 Warrensville Center Rd Unit 3A
- 3271 Warrensville Center Rd
- 3271 Warrensville Center Rd
- 3271 Warrensville Center Rd
- 3271 Warrensville Center Rd Unit 8B
- 3271 Warrensville Center Rd Unit 6A
- 3271 Warrensville Center Rd Unit 8B
- 3279 Warrensville Center Rd Unit 18D
- 3279 Warrensville Center Rd Unit 10C
- 3279 Warrensville Center Rd Unit 9B