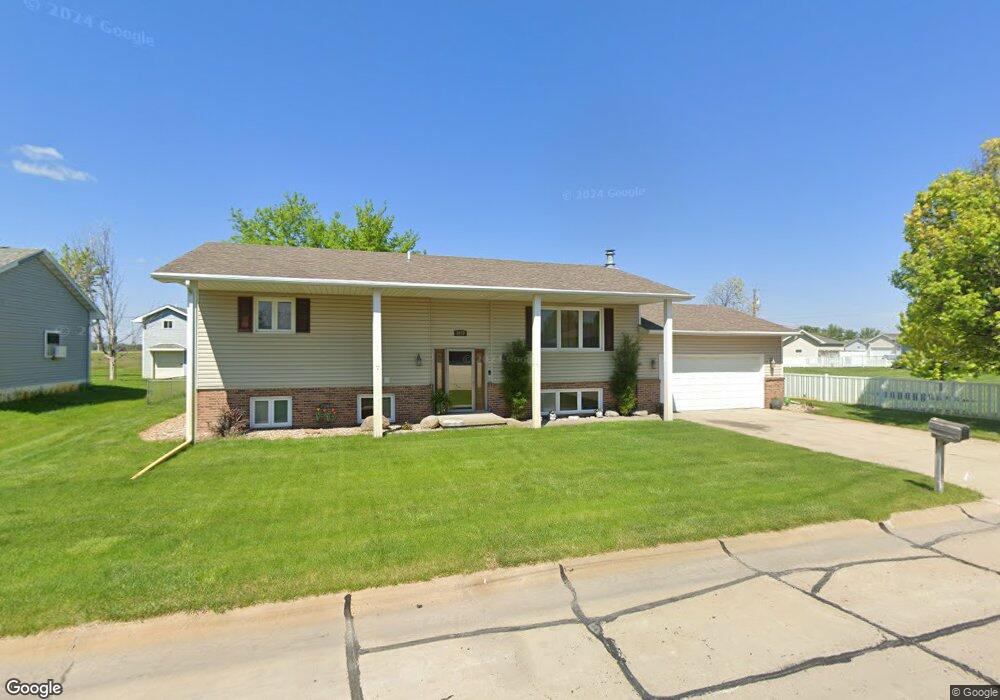
3272 51st Ave Columbus, NE 68601
Estimated Value: $240,426 - $302,000
--
Bed
2
Baths
1,104
Sq Ft
$240/Sq Ft
Est. Value
About This Home
This home is located at 3272 51st Ave, Columbus, NE 68601 and is currently estimated at $264,857, approximately $239 per square foot. 3272 51st Ave is a home located in Platte County with nearby schools including Lost Creek Elementary School, Columbus Middle School, and Columbus High School.
Ownership History
Date
Name
Owned For
Owner Type
Purchase Details
Closed on
May 1, 2024
Sold by
Dush Robert S
Bought by
Fernandez Almaguer Yansi
Current Estimated Value
Purchase Details
Closed on
Apr 5, 2024
Sold by
Thompson Cindy M and Thompson David E
Bought by
Thompson Cindy M
Purchase Details
Closed on
Mar 8, 2021
Sold by
Thompson Cindy M and Thompson David E
Bought by
Thompson Cindy M and Thompson David E
Purchase Details
Closed on
Nov 16, 2009
Sold by
Mcdonald Shawn L
Bought by
Mcdonald Cindy M
Purchase Details
Closed on
Nov 9, 2009
Sold by
Shawn L Mcdonald
Bought by
Mcdonald Cindy M
Create a Home Valuation Report for This Property
The Home Valuation Report is an in-depth analysis detailing your home's value as well as a comparison with similar homes in the area
Home Values in the Area
Average Home Value in this Area
Purchase History
| Date | Buyer | Sale Price | Title Company |
|---|---|---|---|
| Fernandez Almaguer Yansi | $179,000 | 10 County Title | |
| Thompson Cindy M | -- | None Listed On Document | |
| Thompson Cindy M | -- | 10 County Title | |
| Mcdonald Cindy M | -- | -- | |
| Mcdonald Cindy M | -- | -- |
Source: Public Records
Tax History Compared to Growth
Tax History
| Year | Tax Paid | Tax Assessment Tax Assessment Total Assessment is a certain percentage of the fair market value that is determined by local assessors to be the total taxable value of land and additions on the property. | Land | Improvement |
|---|---|---|---|---|
| 2025 | $2,720 | $241,930 | $29,900 | $212,030 |
| 2024 | $2,720 | $215,960 | $29,900 | $186,060 |
| 2023 | $3,771 | $220,090 | $29,900 | $190,190 |
| 2022 | $3,403 | $190,845 | $29,900 | $160,945 |
| 2021 | $3,280 | $184,590 | $23,920 | $160,670 |
| 2020 | $3,103 | $171,060 | $23,920 | $147,140 |
| 2019 | $2,965 | $165,675 | $23,920 | $141,755 |
| 2018 | $3,044 | $165,675 | $23,920 | $141,755 |
| 2017 | $2,857 | $157,215 | $23,920 | $133,295 |
| 2016 | $2,874 | $157,215 | $23,920 | $133,295 |
| 2015 | $2,584 | $140,025 | $17,940 | $122,085 |
| 2014 | $2,641 | $140,025 | $17,940 | $122,085 |
| 2012 | -- | $140,025 | $17,940 | $122,085 |
Source: Public Records
Map
Nearby Homes