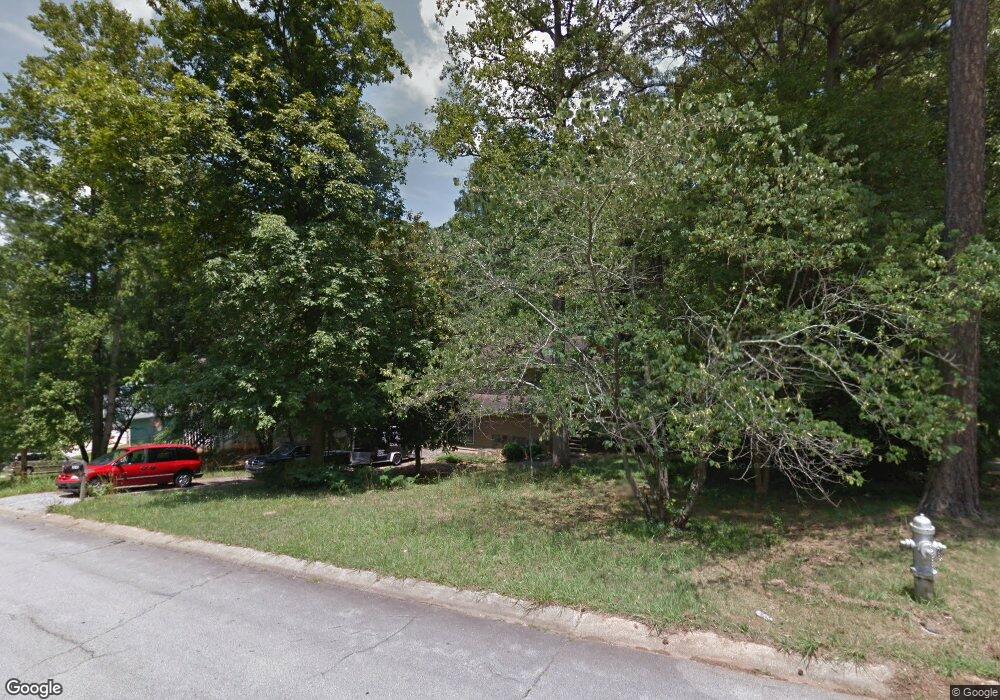
3276 Deshong Dr SW Stone Mountain, GA 30087
Estimated Value: $254,034 - $275,000
About This Home
Please note, our homes are available on a first-come, first-serve basis and are not reserved until the lease is signed by all applicants and security deposits are collected.
This home features Progress Smart Home - Progress Residential's smart home app, which allows you to control the home securely from any of your devices. Learn more at
Want to tour on your own? Click the “Self Tour” button on this home’s listing or call to register for a self-guided showing at a time that works best for you.
Interested in this home? You clearly have exceptional taste. Like all our homes, this one features: a great location in a desirable neighborhood, a comfortable layout with good-sized bedrooms and bathrooms, a great kitchen with plenty of counter and cabinet space, many updated and upgraded features, central HVAC and programmable thermostat, garage and a spacious yard, and it's pet friendly. Call or click to schedule a tour or submit your application online at today!
At Progress Residential® we're here to serve you and make your time in the home as convenient as possible. We offer: a safe and secure online portal where you can place maintenance requests and pay online, multiple payment options, 24/7 Emergency maintenance response team available even on weekends, and well-maintained homes with regular preventative maintenance.
Ownership History
Purchase Details
Purchase Details
Home Financials for this Owner
Home Financials are based on the most recent Mortgage that was taken out on this home.Purchase Details
Home Financials for this Owner
Home Financials are based on the most recent Mortgage that was taken out on this home.Purchase Details
Home Financials for this Owner
Home Financials are based on the most recent Mortgage that was taken out on this home.Purchase Details
Home Values in the Area
Average Home Value in this Area
Purchase History
| Date | Buyer | Sale Price | Title Company |
|---|---|---|---|
| Rha 1 Llc | $67,500 | -- | |
| Salvador Jill | $41,874 | -- | |
| Nest Egg Investments Llc | $25,000 | -- | |
| Huckins Ray | $101,000 | -- | |
| Sec Of Hud | -- | -- | |
| Union Planters Bk | -- | -- |
Mortgage History
| Date | Status | Borrower | Loan Amount |
|---|---|---|---|
| Previous Owner | Salvador Jill | $45,500 | |
| Previous Owner | Huckins Ray | $101,000 |
Property History
| Date | Event | Price | List to Sale | Price per Sq Ft |
|---|---|---|---|---|
| 03/06/2025 03/06/25 | Off Market | $1,785 | -- | -- |
| 02/19/2025 02/19/25 | Price Changed | $1,785 | -1.7% | $1 / Sq Ft |
| 02/18/2025 02/18/25 | Price Changed | $1,815 | -0.5% | $1 / Sq Ft |
| 02/17/2025 02/17/25 | Price Changed | $1,825 | -2.1% | $1 / Sq Ft |
| 02/15/2025 02/15/25 | Price Changed | $1,865 | -2.1% | $1 / Sq Ft |
| 02/08/2025 02/08/25 | Price Changed | $1,905 | -1.0% | $1 / Sq Ft |
| 02/06/2025 02/06/25 | Price Changed | $1,925 | +0.3% | $1 / Sq Ft |
| 02/06/2025 02/06/25 | Price Changed | $1,920 | -1.3% | $1 / Sq Ft |
| 01/20/2025 01/20/25 | Price Changed | $1,945 | +1.6% | $1 / Sq Ft |
| 01/17/2025 01/17/25 | Price Changed | $1,915 | +0.3% | $1 / Sq Ft |
| 01/15/2025 01/15/25 | Price Changed | $1,910 | -23.0% | $1 / Sq Ft |
| 01/13/2025 01/13/25 | For Rent | $2,480 | -- | -- |
Tax History Compared to Growth
Tax History
| Year | Tax Paid | Tax Assessment Tax Assessment Total Assessment is a certain percentage of the fair market value that is determined by local assessors to be the total taxable value of land and additions on the property. | Land | Improvement |
|---|---|---|---|---|
| 2025 | $3,720 | $111,400 | $23,720 | $87,680 |
| 2024 | $4,277 | $109,480 | $23,720 | $85,760 |
| 2023 | $4,277 | $97,320 | $20,000 | $77,320 |
| 2022 | $3,416 | $86,240 | $16,800 | $69,440 |
| 2021 | $2,421 | $57,600 | $12,000 | $45,600 |
| 2020 | $2,433 | $57,600 | $12,000 | $45,600 |
| 2019 | $2,153 | $52,080 | $12,000 | $40,080 |
| 2018 | $2,150 | $52,080 | $12,000 | $40,080 |
| 2016 | $1,504 | $33,120 | $8,000 | $25,120 |
| 2015 | $1,299 | $27,000 | $6,400 | $20,600 |
| 2014 | $1,305 | $27,000 | $6,400 | $20,600 |
Map
- 3216 Deshong Dr
- 5045 Carole Place
- 3298 Drummond Dr Unit 2
- 3346 Deshong Dr
- 5039 Seabrook Place
- 5115 Carole Place
- 3093 Deshong Dr
- 5380 Rock Place Dr
- 3191 Mineral Ridge Ln
- 4770 Feather Creek Ct
- 3047 Sanibel Dr Unit 1
- 5272 Cumberland Way
- 580 Overlook Dr
- 4667 Old Annistown Bridge Rd
- 2878 Heather Row Ridge SW
- 126 Castle Club Dr
- 2901 Carrousel Ct
- 4545 Forrest Bend Ct
- 2877 Heather Row Ridge SW
- 2982 Moorings Pkwy Unit 1
- 3276 Deshong Dr
- 3266 Deshong Dr Unit 2
- 3286 Deshong Dr Unit 2
- 3256 Deshong Dr
- 3296 Deshong Dr Unit 2
- 3273 Deshong Dr
- 3263 Deshong Dr Unit 2
- 3283 Deshong Dr
- 3253 Deshong Dr
- 3246 Deshong Dr
- 3306 Deshong Dr
- 4985 Carole Place Unit 2
- 3243 Deshong Dr
- 3292 Mixon Way
- 3316 Deshong Dr SW
- 3282 Mixon Way
- 4995 Carole Place Unit 2
- 3236 Deshong Dr Unit 2
- 3316 Deshong Dr
- 3272 Mixon Way Unit 3