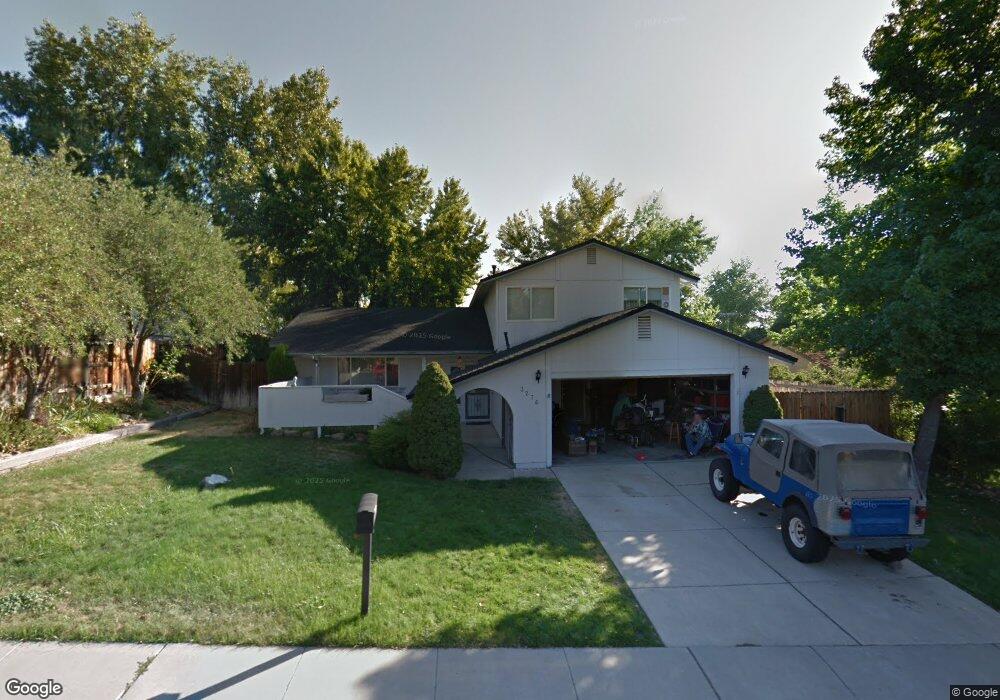
3276 Holman Way Unit 2 Sparks, NV 89431
North Rock NeighborhoodEstimated Value: $490,000 - $580,000
4
Beds
3
Baths
2,084
Sq Ft
$247/Sq Ft
Est. Value
About This Home
This home is located at 3276 Holman Way Unit 2, Sparks, NV 89431 and is currently estimated at $514,096, approximately $246 per square foot. 3276 Holman Way Unit 2 is a home located in Washoe County with nearby schools including Alice Maxwell Elementary School, Sparks Middle School, and Sparks High School.
Ownership History
Date
Name
Owned For
Owner Type
Purchase Details
Closed on
Oct 22, 2020
Sold by
Perry Michael M and Perry Jolanta M
Bought by
Perry Michael M and Perry Jolanta M
Current Estimated Value
Purchase Details
Closed on
Feb 13, 2019
Sold by
Perry Jolanta M and Nicholson Jolanta M
Bought by
Perry Michael M and Perry Jolanta M
Home Financials for this Owner
Home Financials are based on the most recent Mortgage that was taken out on this home.
Original Mortgage
$343,000
Outstanding Balance
$300,943
Interest Rate
4.4%
Mortgage Type
VA
Estimated Equity
$213,153
Purchase Details
Closed on
Nov 15, 2010
Sold by
Unger Jasper Allen and Unger Beth Anne
Bought by
Nicholson Jolanta M
Home Financials for this Owner
Home Financials are based on the most recent Mortgage that was taken out on this home.
Original Mortgage
$165,690
Interest Rate
4.5%
Mortgage Type
FHA
Purchase Details
Closed on
Oct 24, 1994
Sold by
Minor Jerry L and Minor Kleis K
Bought by
Unger Jasper Allen and Unger Beth Ann
Home Financials for this Owner
Home Financials are based on the most recent Mortgage that was taken out on this home.
Original Mortgage
$141,455
Interest Rate
8.7%
Create a Home Valuation Report for This Property
The Home Valuation Report is an in-depth analysis detailing your home's value as well as a comparison with similar homes in the area
Home Values in the Area
Average Home Value in this Area
Purchase History
| Date | Buyer | Sale Price | Title Company |
|---|---|---|---|
| Perry Michael M | -- | None Available | |
| Perry Michael M | -- | Amrock Inc | |
| Nicholson Jolanta M | $170,000 | First Centennial Reno | |
| Unger Jasper Allen | $149,000 | First Centennial Title Co |
Source: Public Records
Mortgage History
| Date | Status | Borrower | Loan Amount |
|---|---|---|---|
| Open | Perry Michael M | $343,000 | |
| Closed | Nicholson Jolanta M | $165,690 | |
| Previous Owner | Unger Jasper Allen | $141,455 |
Source: Public Records
Tax History Compared to Growth
Tax History
| Year | Tax Paid | Tax Assessment Tax Assessment Total Assessment is a certain percentage of the fair market value that is determined by local assessors to be the total taxable value of land and additions on the property. | Land | Improvement |
|---|---|---|---|---|
| 2025 | $1,821 | $67,773 | $35,875 | $31,898 |
| 2024 | $1,821 | $68,928 | $35,875 | $33,053 |
| 2023 | $1,769 | $68,732 | $36,540 | $32,192 |
| 2022 | $1,719 | $56,556 | $28,980 | $27,577 |
| 2021 | $1,670 | $50,311 | $22,225 | $28,086 |
| 2020 | $1,620 | $51,000 | $22,225 | $28,775 |
| 2019 | $1,574 | $49,758 | $21,280 | $28,478 |
| 2018 | $1,528 | $43,922 | $15,610 | $28,312 |
| 2017 | $1,465 | $42,313 | $13,440 | $28,873 |
| 2016 | $1,428 | $42,620 | $12,600 | $30,020 |
| 2015 | $1,426 | $42,389 | $11,725 | $30,664 |
| 2014 | $1,383 | $37,568 | $7,770 | $29,798 |
| 2013 | -- | $36,906 | $7,140 | $29,766 |
Source: Public Records
Map
Nearby Homes
- 3252 Holman Way
- 3269 Valley Forge Way
- 5530 High Rock Way
- 5650 Wedekind Rd
- 780 Emerson Way
- 0 N Mccarran Blvd Unit 250052909
- 1125 Dodson Way
- 1345 Plymouth Way
- 1160 York Way
- 465 Lenwood Dr
- 1110 Xman Way
- 3465 Dawn Cir
- 1731 Gault Way Unit D
- 1595 York Way
- 3607 Keogh Dr
- 2154 Oppio St
- 3545 4th St
- 119 Devere Way
- 3245 Elaine Way
- 1124 Sbragia Way
- 3266 Holman Way
- 3286 Holman Way
- 3279 Bunker Hill Ln
- 3273 Bunker Hill Ln
- 3256 Holman Way
- 3296 Holman Way
- 3277 Holman Way
- 3267 Holman Way
- 3287 Holman Way
- 3263 Bunker Hill Ln
- 3293 Bunker Hill Ln
- 3257 Holman Way
- 3297 Holman Way
- 3253 Bunker Hill Ln
- 3247 Holman Way
- 3278 Bunker Hill Ln
- 3274 Valley Forge Way Unit 2
- 3264 Valley Forge Way
- 3272 Bunker Hill Ln
- 3288 Bunker Hill Ln