Estimated Value: $738,040 - $903,000
5
Beds
4
Baths
1,835
Sq Ft
$429/Sq Ft
Est. Value
About This Home
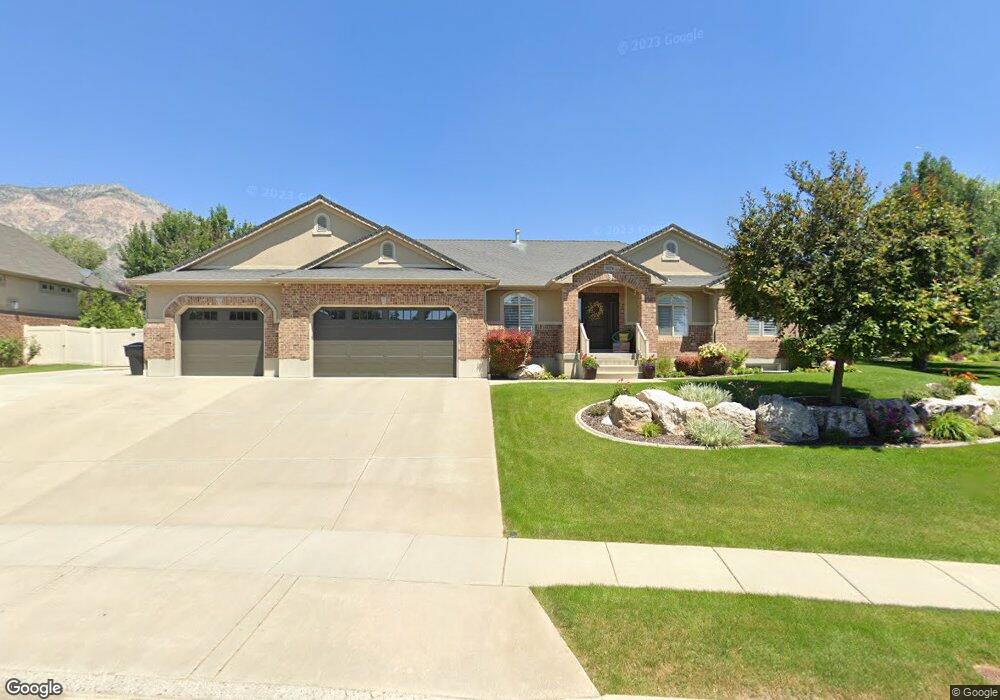
This home is located at 3276 Macintosh Way, Ogden, UT 84414 and is currently estimated at $787,260, approximately $429 per square foot. 3276 Macintosh Way is a home located in Weber County with nearby schools including Orion Junior High School, Weber High School, and Maria Montessori Academy.
Ownership History
Date
Name
Owned For
Owner Type
Purchase Details
Closed on
Mar 14, 2005
Sold by
Overland Homes Inc
Bought by
Brenkman Scott H and Brenkman Lisa
Current Estimated Value
Home Financials for this Owner
Home Financials are based on the most recent Mortgage that was taken out on this home.
Original Mortgage
$250,000
Outstanding Balance
$126,743
Interest Rate
5.61%
Mortgage Type
Seller Take Back
Estimated Equity
$660,517
Purchase Details
Closed on
Jan 6, 2005
Sold by
The Mountain Orchards Llc
Bought by
Overland Homes Inc
Purchase Details
Closed on
Dec 10, 2004
Sold by
Neeley Sharon H and Stoddard Sharon H
Bought by
Skcc Llc
Purchase Details
Closed on
Nov 12, 2004
Sold by
The Orchards Llc
Bought by
The Mountain Orchards Llc
Create a Home Valuation Report for This Property
The Home Valuation Report is an in-depth analysis detailing your home's value as well as a comparison with similar homes in the area
Home Values in the Area
Average Home Value in this Area
Purchase History
| Date | Buyer | Sale Price | Title Company |
|---|---|---|---|
| Brenkman Scott H | -- | -- | |
| Overland Homes Inc | -- | Mountain View Title Ogden | |
| Skcc Llc | -- | Hickman Land Title Company | |
| The Mountain Orchards Llc | -- | Mountain View Title |
Source: Public Records
Mortgage History
| Date | Status | Borrower | Loan Amount |
|---|---|---|---|
| Open | Brenkman Scott H | $250,000 |
Source: Public Records
Tax History
| Year | Tax Paid | Tax Assessment Tax Assessment Total Assessment is a certain percentage of the fair market value that is determined by local assessors to be the total taxable value of land and additions on the property. | Land | Improvement |
|---|---|---|---|---|
| 2025 | $4,798 | $768,343 | $221,286 | $547,057 |
| 2024 | $4,692 | $415,249 | $121,707 | $293,542 |
| 2023 | $4,868 | $435,050 | $121,536 | $313,514 |
| 2022 | $4,725 | $431,750 | $110,465 | $321,285 |
| 2021 | $4,125 | $637,000 | $135,729 | $501,271 |
| 2020 | $3,715 | $528,000 | $125,582 | $402,418 |
| 2019 | $3,670 | $498,000 | $120,454 | $377,546 |
| 2018 | $3,459 | $449,000 | $90,506 | $358,494 |
| 2017 | $3,253 | $398,000 | $90,506 | $307,494 |
| 2016 | $2,871 | $190,171 | $44,539 | $145,632 |
| 2015 | $2,791 | $183,635 | $47,352 | $136,283 |
| 2014 | $2,516 | $161,353 | $39,087 | $122,266 |
Source: Public Records
Map
Nearby Homes
- 1076 Mountain Orchard Dr
- 3352 N 1100 W
- 3230 N 1000 W
- 0 W Pleasant View Dr
- 1012 W 3550 N
- 3414 N 1160 W Unit 214-R
- 789 W 3500 N
- 993 W 3800 N
- 1379 W 3125 N
- 1026 W 3800 N
- 641 W Elberta Dr Unit 1
- 1616 W 3125 N Unit 7
- 1621 W 3125 N Unit 4
- 1629 W 3125 N
- 1629 W 3125 N Unit 5
- 731 W 3750 N
- 2750 N Parkland Blvd E Unit 16
- 3875 N 1000 W
- 3252 N 600 W
- 3900 N 1000 W
- 3284 Macintosh Way
- 3264 Macintosh Way
- 3337 Casey Ln
- 3276 N 1050 W
- 3355 N Casey Ln
- 3298 Macintosh Way
- 3313 N Casey Ln
- 3260 Macintosh Way
- 3266 N 1050 W
- 3377 N Casey Ln Unit 16
- 3255 Macintosh Way
- 3291 Casey Ln
- 1024 W 3350 N
- 3372 Casey Ln
- 1038 W 3250 N
- 3297 N 1050 W
- 3281 N 1050 W
- 3281 N 1050 W Unit 37
- 3407 N Casey Ln
- 3258 N 1050 W
Your Personal Tour Guide
Ask me questions while you tour the home.