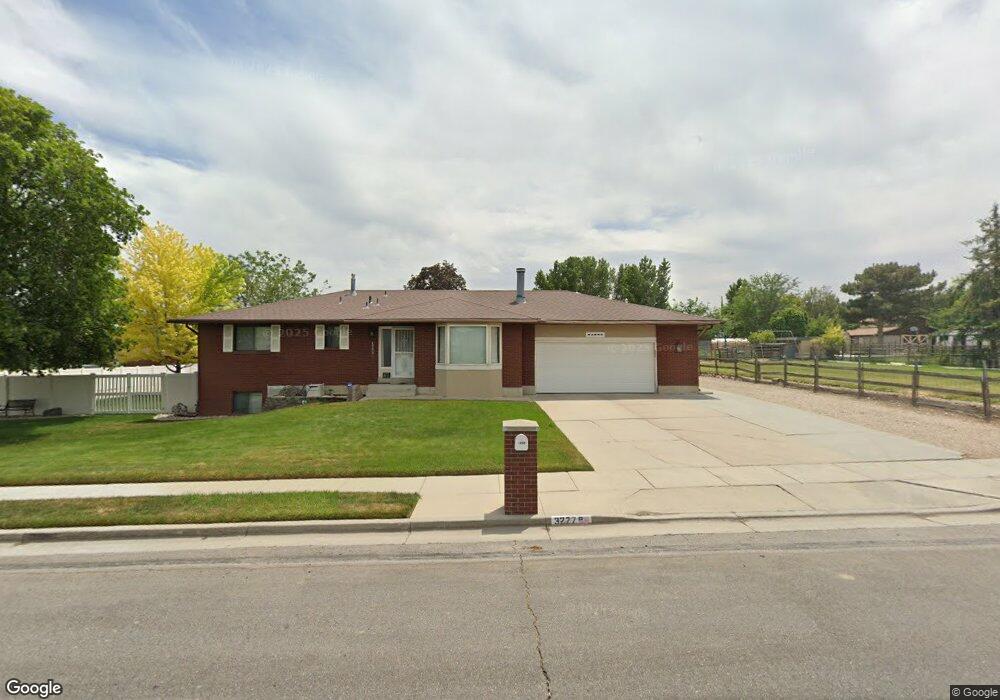
3277 W 10000 S South Jordan, UT 84095
Estimated Value: $793,000 - $887,675
5
Beds
3
Baths
3,660
Sq Ft
$227/Sq Ft
Est. Value
About This Home
This home is located at 3277 W 10000 S, South Jordan, UT 84095 and is currently estimated at $830,669, approximately $226 per square foot. 3277 W 10000 S is a home located in Salt Lake County with nearby schools including Elk Meadows Elementary School, Elk Ridge Middle School, and Hawthorn Academy.
Ownership History
Date
Name
Owned For
Owner Type
Purchase Details
Closed on
Nov 14, 2016
Sold by
Carling Craing and Carling Gaye Lynn
Bought by
Carling Dale Craing and Carling Gaye Lynn
Current Estimated Value
Purchase Details
Closed on
Oct 28, 2016
Sold by
Carting Dale Carig and Carting Gayelynn
Bought by
Carling Dale Craig and Carling Gaye Lynn
Purchase Details
Closed on
Aug 25, 1999
Sold by
Gibb Lois
Bought by
Carling Craig and Carling Gaye Lynn
Home Financials for this Owner
Home Financials are based on the most recent Mortgage that was taken out on this home.
Original Mortgage
$160,000
Outstanding Balance
$45,655
Interest Rate
7.56%
Estimated Equity
$785,014
Purchase Details
Closed on
Mar 16, 1994
Sold by
Thompson W Peter
Bought by
Thompson W Peter
Create a Home Valuation Report for This Property
The Home Valuation Report is an in-depth analysis detailing your home's value as well as a comparison with similar homes in the area
Home Values in the Area
Average Home Value in this Area
Purchase History
| Date | Buyer | Sale Price | Title Company |
|---|---|---|---|
| Carling Dale Craing | -- | None Available | |
| Carling Dale Craing | -- | None Available | |
| Carling Dale Craig | -- | None Available | |
| Carling Craig | -- | Meridian Title | |
| Thompson W Peter | -- | -- |
Source: Public Records
Mortgage History
| Date | Status | Borrower | Loan Amount |
|---|---|---|---|
| Open | Carling Craig | $160,000 |
Source: Public Records
Tax History Compared to Growth
Tax History
| Year | Tax Paid | Tax Assessment Tax Assessment Total Assessment is a certain percentage of the fair market value that is determined by local assessors to be the total taxable value of land and additions on the property. | Land | Improvement |
|---|---|---|---|---|
| 2025 | $3,880 | $835,700 | $381,400 | $454,300 |
| 2024 | $3,880 | $736,700 | $359,900 | $376,800 |
| 2023 | $4,102 | $734,900 | $356,400 | $378,500 |
| 2022 | $4,231 | $742,900 | $349,400 | $393,500 |
| 2021 | $3,495 | $563,000 | $266,700 | $296,300 |
| 2020 | $3,312 | $500,200 | $266,700 | $233,500 |
| 2019 | $3,141 | $466,300 | $261,000 | $205,300 |
| 2018 | $2,930 | $432,700 | $182,400 | $250,300 |
| 2017 | $2,856 | $413,400 | $182,400 | $231,000 |
| 2016 | $2,609 | $357,800 | $182,400 | $175,400 |
| 2015 | $2,727 | $363,700 | $197,600 | $166,100 |
| 2014 | $2,675 | $350,600 | $190,800 | $159,800 |
Source: Public Records
Map
Nearby Homes
- 10182 S Chattel Cir
- 1578 W Banner Dr Unit 745
- 1558 W Banner Dr Unit 805
- 1574 W Banner Dr Unit 743
- 1576 W Banner Dr Unit 744
- 1556 W Banner Dr Unit 806
- 1548 W Banner Dr Unit 809
- 1552 W Banner Dr Unit 807
- 1553 W Banner Dr Unit 844
- 10177 Statesman Place
- 10339 S Cold Moon Place
- 3312 W Harvest Grove Way
- 10252 S 3570 W
- 3274 W Harvest Chase Dr
- 3651 W 10200 S Unit 11
- Raddison Plan at Eagles Landing
- Wembly Plan at Eagles Landing
- Whitmore Plan at Eagles Landing
- Richmond Plan at Eagles Landing
- Regal Plan at Eagles Landing
- 3255 W 10000 S
- 3301 W 10000 S
- 3286 W 10000 S
- 9977 S 3265 W
- 3310 W 10000 S
- 3260 W 10000 S
- 3244 W 10000 S
- 9972 S 3265 W
- 3237 W 10000 S
- 10023 S 3345 W
- 3326 W 10000 S
- 3236 W 10000 S
- 10033 S 3345 W
- 10070 Chattel Cir
- 10070 S Chattel Cir
- 9969 S 3265 W
- 10053 S 3345 W
- 9955 S 3265 W
- 3215 W 10000 S
- 10028 S 3200 W Unit 23B