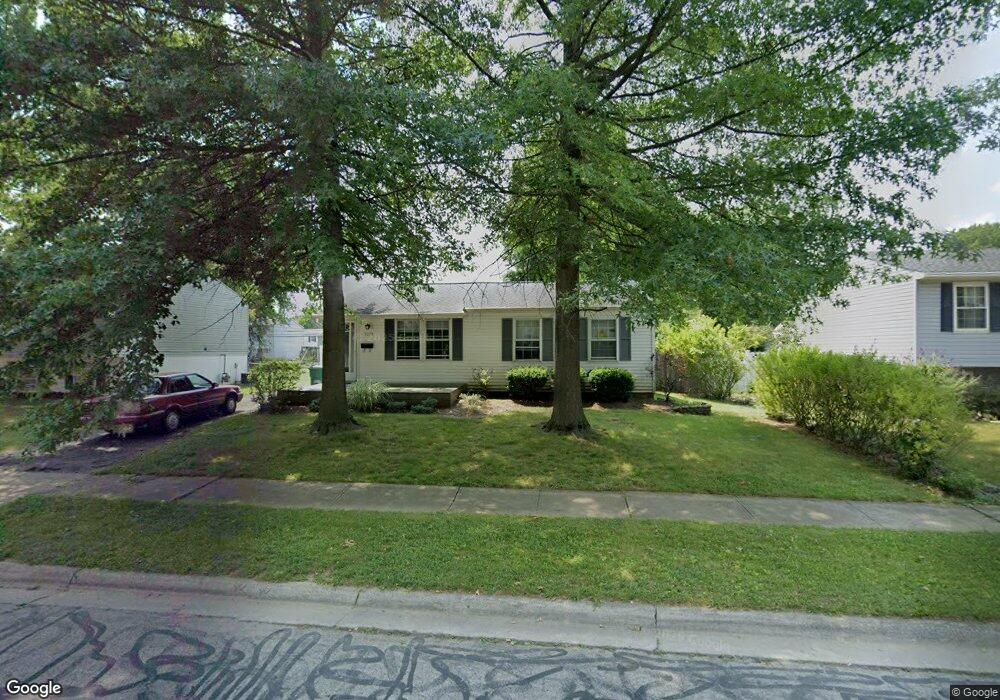
3279 Fontaine Rd Columbus, OH 43232
East Columbus-White Ash NeighborhoodEstimated Value: $193,000 - $239,000
3
Beds
1
Bath
936
Sq Ft
$225/Sq Ft
Est. Value
About This Home
This home is located at 3279 Fontaine Rd, Columbus, OH 43232 and is currently estimated at $210,472, approximately $224 per square foot. 3279 Fontaine Rd is a home located in Franklin County with nearby schools including Groveport Madison High School, A+ Arts Academy, and Eastland Preparatory Academy.
Ownership History
Date
Name
Owned For
Owner Type
Purchase Details
Closed on
Oct 31, 2018
Sold by
Ross John A
Bought by
Zacarias Kathryn M and Zacarias Sanchez Marco Antonio
Current Estimated Value
Home Financials for this Owner
Home Financials are based on the most recent Mortgage that was taken out on this home.
Original Mortgage
$77,000
Outstanding Balance
$67,568
Interest Rate
4.7%
Mortgage Type
New Conventional
Estimated Equity
$142,904
Purchase Details
Closed on
Sep 9, 2003
Sold by
Olson John R and Olson Theresa L
Bought by
Ross John A
Home Financials for this Owner
Home Financials are based on the most recent Mortgage that was taken out on this home.
Original Mortgage
$73,100
Interest Rate
5.12%
Mortgage Type
Purchase Money Mortgage
Purchase Details
Closed on
Dec 22, 1988
Bought by
Olson John R and Olson Theresa L
Purchase Details
Closed on
Feb 1, 1984
Create a Home Valuation Report for This Property
The Home Valuation Report is an in-depth analysis detailing your home's value as well as a comparison with similar homes in the area
Home Values in the Area
Average Home Value in this Area
Purchase History
| Date | Buyer | Sale Price | Title Company |
|---|---|---|---|
| Zacarias Kathryn M | $120,000 | Genesis Title Box | |
| Ross John A | $91,400 | Columbus Title | |
| Olson John R | $59,900 | -- | |
| -- | -- | -- |
Source: Public Records
Mortgage History
| Date | Status | Borrower | Loan Amount |
|---|---|---|---|
| Open | Zacarias Kathryn M | $77,000 | |
| Previous Owner | Ross John A | $73,100 |
Source: Public Records
Tax History Compared to Growth
Tax History
| Year | Tax Paid | Tax Assessment Tax Assessment Total Assessment is a certain percentage of the fair market value that is determined by local assessors to be the total taxable value of land and additions on the property. | Land | Improvement |
|---|---|---|---|---|
| 2024 | $3,206 | $66,260 | $16,280 | $49,980 |
| 2023 | $3,183 | $66,260 | $16,280 | $49,980 |
| 2022 | $2,310 | $36,270 | $6,060 | $30,210 |
| 2021 | $2,270 | $36,270 | $6,060 | $30,210 |
| 2020 | $2,245 | $36,270 | $6,060 | $30,210 |
| 2019 | $2,226 | $31,640 | $5,250 | $26,390 |
| 2018 | $2,046 | $28,840 | $5,250 | $23,590 |
| 2017 | $2,051 | $28,840 | $5,250 | $23,590 |
| 2016 | $2,045 | $26,010 | $3,920 | $22,090 |
| 2015 | $2,048 | $26,010 | $3,920 | $22,090 |
| 2014 | $1,883 | $26,010 | $3,920 | $22,090 |
| 2013 | $910 | $28,875 | $4,340 | $24,535 |
Source: Public Records
Map
Nearby Homes
- 5422 Everson Rd N
- 3387 Retriever Rd
- 5397 Jack Russell Way
- 5323 Sundale Place S
- 3246 Latonia Rd
- 5522 Newport Ct
- 5143 Rutledge Dr N
- 3333 Latonia Ct
- 5152 Burdett Dr
- 2998 Osgood Rd E
- 3067 Argonne Ct
- 3289 Kady Ln
- 5254 Sedalia Dr
- 5391 Newport Rd
- 5373 Spire Ln
- 5401 Spire Ln
- 3275 Faycrest Rd
- 3291 Yozuri Dr
- 3455 Tremaine Rd
- 3493 Tremaine Rd
- 3287 Fontaine Rd
- 3269 Fontaine Rd
- 3280 Everson Rd E
- 3299 Fontaine Rd
- 3261 Fontaine Rd
- 3288 Everson Rd E
- 3280 Fontaine Rd
- 3305 Fontaine Rd
- 3294 Everson Rd E
- 3288 Fontaine Rd
- 3270 Fontaine Rd
- 5475 Baynard Dr
- 5466 Everson Rd N
- 5467 Baynard Dr
- 3300 Fontaine Rd
- 3262 Fontaine Rd
- 5455 Baynard Dr
- 3302 Everson Rd E
- 3315 Fontaine Rd
- 3306 Fontaine Rd