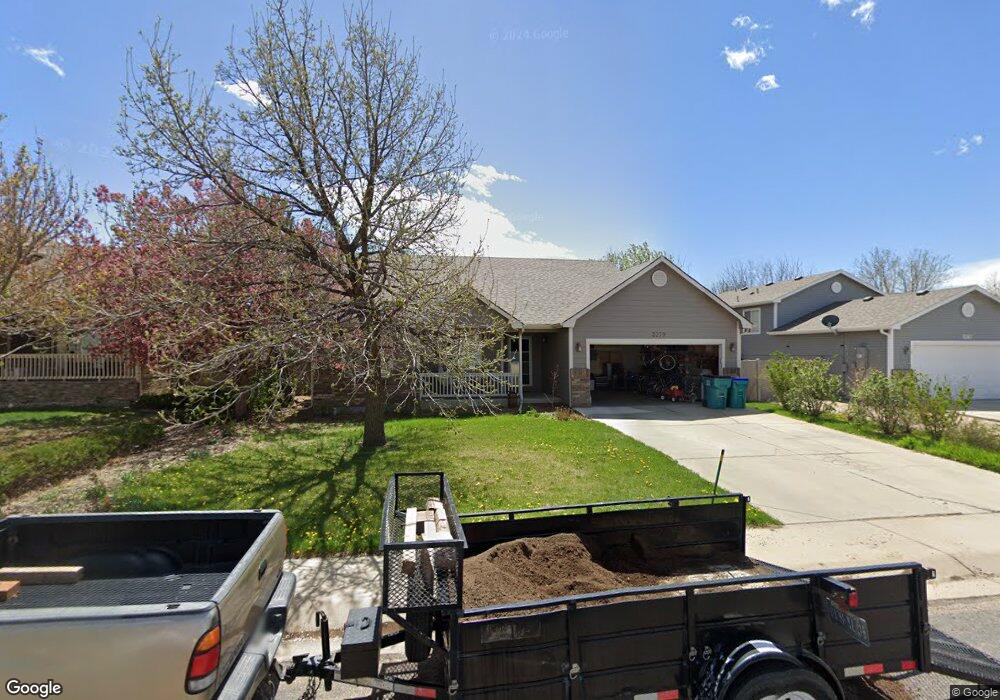
3279 Thundering Herd Way Wellington, CO 80549
Estimated Value: $438,311 - $458,000
3
Beds
2
Baths
1,481
Sq Ft
$303/Sq Ft
Est. Value
About This Home
This home is located at 3279 Thundering Herd Way, Wellington, CO 80549 and is currently estimated at $448,078, approximately $302 per square foot. 3279 Thundering Herd Way is a home located in Larimer County with nearby schools including Eyestone Elementary School and Wellington Middle School.
Ownership History
Date
Name
Owned For
Owner Type
Purchase Details
Closed on
Mar 31, 2005
Sold by
Cramer Forrest Thomas and Boos Billie Jo
Bought by
Cramer Forrest Thomas and Cramer Billie Jo
Current Estimated Value
Home Financials for this Owner
Home Financials are based on the most recent Mortgage that was taken out on this home.
Original Mortgage
$152,000
Outstanding Balance
$78,286
Interest Rate
5.75%
Mortgage Type
New Conventional
Estimated Equity
$369,792
Purchase Details
Closed on
Jul 21, 2004
Sold by
J & J Construction Of Northern Co Llc
Bought by
Cramer Forrest Thomas and Boos Billie Jo
Home Financials for this Owner
Home Financials are based on the most recent Mortgage that was taken out on this home.
Original Mortgage
$146,560
Interest Rate
5.87%
Mortgage Type
New Conventional
Create a Home Valuation Report for This Property
The Home Valuation Report is an in-depth analysis detailing your home's value as well as a comparison with similar homes in the area
Home Values in the Area
Average Home Value in this Area
Purchase History
| Date | Buyer | Sale Price | Title Company |
|---|---|---|---|
| Cramer Forrest Thomas | -- | Tri City Title | |
| Cramer Forrest Thomas | $183,200 | -- |
Source: Public Records
Mortgage History
| Date | Status | Borrower | Loan Amount |
|---|---|---|---|
| Open | Cramer Forrest Thomas | $152,000 | |
| Closed | Cramer Forrest Thomas | $146,560 | |
| Closed | Cramer Forrest Thomas | $18,320 | |
| Closed | Cramer Forrest Thomas | $19,000 |
Source: Public Records
Tax History Compared to Growth
Tax History
| Year | Tax Paid | Tax Assessment Tax Assessment Total Assessment is a certain percentage of the fair market value that is determined by local assessors to be the total taxable value of land and additions on the property. | Land | Improvement |
|---|---|---|---|---|
| 2025 | $3,114 | $31,879 | $8,040 | $23,839 |
| 2024 | $2,987 | $31,879 | $8,040 | $23,839 |
| 2022 | $2,565 | $23,380 | $2,641 | $20,739 |
| 2021 | $2,600 | $24,053 | $2,717 | $21,336 |
| 2020 | $2,573 | $23,624 | $2,717 | $20,907 |
| 2019 | $2,583 | $23,624 | $2,717 | $20,907 |
| 2018 | $1,995 | $18,691 | $2,736 | $15,955 |
| 2017 | $1,990 | $18,691 | $2,736 | $15,955 |
| 2016 | $1,709 | $17,003 | $3,025 | $13,978 |
| 2015 | $1,682 | $17,000 | $3,020 | $13,980 |
| 2014 | $1,471 | $14,710 | $3,020 | $11,690 |
Source: Public Records
Map
Nearby Homes
- 3328 Wild Ln W
- 3325 Wigwam Way
- 3340 Wigwam Way
- 8805 Flaming Arrow Ave
- 8546 Seattle Slew Ln
- 8480 Three Silos Dr
- 3270 White Buffalo Dr
- 3268 White Buffalo Dr
- 3398 White Buffalo Dr
- 8873 Indian Village Dr
- 3399 Firewater Ln
- 8419 Three Silos Dr
- 3364 Firewater Ln
- 3376 Firewater Ln
- 9074 Plainsman Dr
- 3182 Fairmont Dr Unit C
- 3145 Alybar Dr Unit 16B
- 3725 Henderson Ave
- 3474 Iron Horse Way
- 3730 Garfield Ave
- 3291 Thundering Herd Way
- 3267 Thundering Herd Way
- 3313 Thundering Herd Way
- 3282 Thundering Herd Way
- 3294 Thundering Herd Way
- 3270 Thundering Herd Way
- 3325 Thundering Herd Way
- 3316 Thundering Herd Way
- 3268 Thundering Herd Way
- 3328 Thundering Herd Way
- 3281 Wild West Ln
- 3337 Thundering Herd Way
- 3293 Wild West Ln
- 3279 Wild West Ln
- 3233 Thundering Herd Way
- 3313 Wild West Ln
- 3279 Wild Ln W
- 3267 Wild West Ln
- 3313 Wild Ln W
- 3275 Mammoth Cir