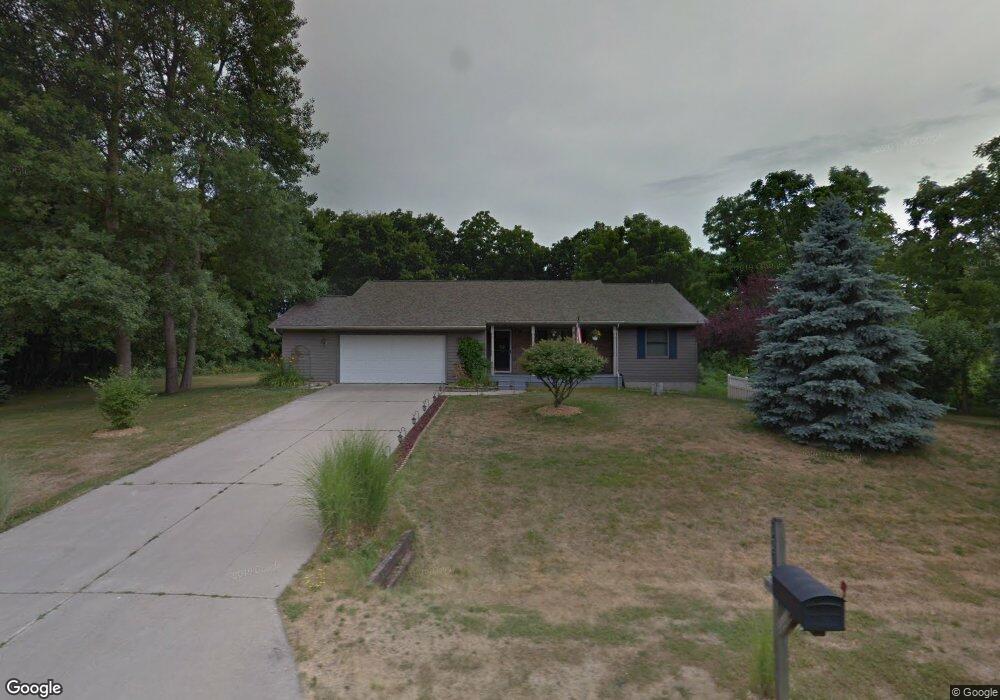
32790 MacKaprang St Paw Paw, MI 49079
Estimated Value: $299,000 - $340,000
3
Beds
3
Baths
1,392
Sq Ft
$231/Sq Ft
Est. Value
About This Home
This home is located at 32790 MacKaprang St, Paw Paw, MI 49079 and is currently estimated at $321,699, approximately $231 per square foot. 32790 MacKaprang St is a home located in Van Buren County with nearby schools including Paw Paw Early Elementary School, Paw Paw Later Elementary School, and Paw Paw Middle School.
Ownership History
Date
Name
Owned For
Owner Type
Purchase Details
Closed on
Mar 25, 2011
Sold by
Campbell Robert J and Campbell Lynda
Bought by
Leese Sarah A and Leese Eric J
Current Estimated Value
Home Financials for this Owner
Home Financials are based on the most recent Mortgage that was taken out on this home.
Original Mortgage
$160,517
Outstanding Balance
$111,837
Interest Rate
5.09%
Mortgage Type
New Conventional
Estimated Equity
$209,862
Purchase Details
Closed on
Aug 7, 1997
Sold by
Kempski Frederick A and Kempski Shirley
Bought by
Campbell Robert and Campbell Lynda
Create a Home Valuation Report for This Property
The Home Valuation Report is an in-depth analysis detailing your home's value as well as a comparison with similar homes in the area
Home Values in the Area
Average Home Value in this Area
Purchase History
| Date | Buyer | Sale Price | Title Company |
|---|---|---|---|
| Leese Sarah A | $154,900 | Dba Ppr Title Agency | |
| Campbell Robert | $153,000 | -- |
Source: Public Records
Mortgage History
| Date | Status | Borrower | Loan Amount |
|---|---|---|---|
| Open | Leese Sarah A | $160,517 |
Source: Public Records
Tax History Compared to Growth
Tax History
| Year | Tax Paid | Tax Assessment Tax Assessment Total Assessment is a certain percentage of the fair market value that is determined by local assessors to be the total taxable value of land and additions on the property. | Land | Improvement |
|---|---|---|---|---|
| 2025 | $1,062 | $156,500 | $0 | $0 |
| 2024 | $1,062 | $145,500 | $0 | $0 |
| 2023 | $1,012 | $117,200 | $0 | $0 |
| 2022 | $3,163 | $110,100 | $0 | $0 |
| 2021 | $3,097 | $94,000 | $15,300 | $78,700 |
| 2020 | $2,941 | $94,000 | $15,300 | $78,700 |
| 2019 | $2,803 | $91,900 | $22,800 | $69,100 |
| 2018 | $2,738 | $90,400 | $31,200 | $59,200 |
| 2017 | $2,684 | $89,800 | $10,785 | $79,015 |
| 2016 | $2,667 | $92,400 | $10,785 | $81,615 |
| 2015 | $2,391 | $92,400 | $10,785 | $81,615 |
| 2014 | $2,347 | $93,200 | $0 | $0 |
| 2013 | -- | $85,300 | $12,800 | $72,500 |
Source: Public Records
Map
Nearby Homes
- 10 MacKaprang St
- 34 MacKaprang St
- 18 MacKaprang St
- 19 MacKaprang St
- 31 MacKaprang St
- 33 MacKaprang St
- 27 MacKaprang St
- 0 MacKaprang St
- 0 MacKaprang St
- 0 MacKaprang St
- 32844 Winther Ave
- 32964 MacKaprang St
- 32610 MacKaprang St
- 32853 Bradeen Ave
- 33131 MacKaprang St
- 32806 Winther St
- 32806 Winther Ave
- 49000 Bradeen Ave
- 33088 MacKaprang St
- 32801 Winther Ave