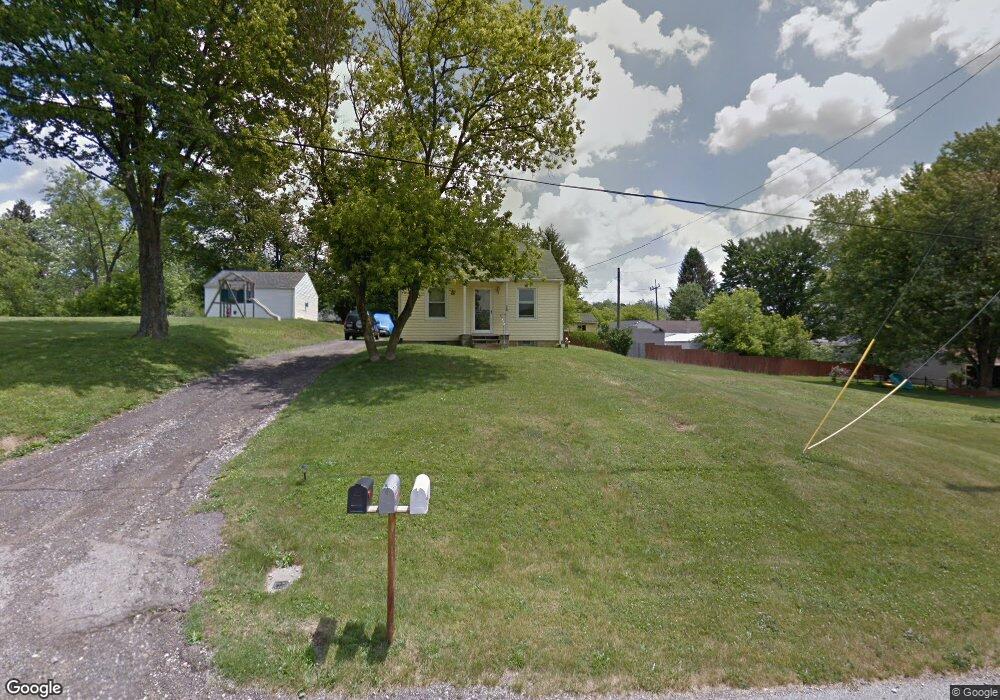
328 7th Ave Mansfield, OH 44905
Estimated Value: $80,000 - $114,000
4
Beds
1
Bath
1,104
Sq Ft
$89/Sq Ft
Est. Value
About This Home
This home is located at 328 7th Ave, Mansfield, OH 44905 and is currently estimated at $98,271, approximately $89 per square foot. 328 7th Ave is a home located in Richland County with nearby schools including Madison High School, Temple-Christian School, and St. Peter's Elementary/Montessori School.
Ownership History
Date
Name
Owned For
Owner Type
Purchase Details
Closed on
Sep 25, 2009
Sold by
Yohman Judy L
Bought by
Yohman Steven C
Current Estimated Value
Purchase Details
Closed on
Jul 31, 2003
Sold by
First Alliance Church
Bought by
Yohman Steven C and Yohman Judy L
Purchase Details
Closed on
Jul 8, 2003
Sold by
Deruffe Blomeir Francoise M and Blomeier Harold E
Bought by
Yohman Steven C and Yohman Judy L
Create a Home Valuation Report for This Property
The Home Valuation Report is an in-depth analysis detailing your home's value as well as a comparison with similar homes in the area
Home Values in the Area
Average Home Value in this Area
Purchase History
| Date | Buyer | Sale Price | Title Company |
|---|---|---|---|
| Yohman Steven C | -- | Attorney | |
| Yohman Steven C | $5,000 | Lawyers Title | |
| Deruffe Blomeir Francoise M | -- | Lawyers Title | |
| Yohman Steven C | $5,000 | Lawyers Title |
Source: Public Records
Mortgage History
| Date | Status | Borrower | Loan Amount |
|---|---|---|---|
| Previous Owner | Yohman Steven C | $21,600 | |
| Previous Owner | Yohman Steven C | $40,000 |
Source: Public Records
Tax History Compared to Growth
Tax History
| Year | Tax Paid | Tax Assessment Tax Assessment Total Assessment is a certain percentage of the fair market value that is determined by local assessors to be the total taxable value of land and additions on the property. | Land | Improvement |
|---|---|---|---|---|
| 2024 | $727 | $17,600 | $6,420 | $11,180 |
| 2023 | $727 | $17,600 | $6,420 | $11,180 |
| 2022 | $725 | $16,160 | $6,680 | $9,480 |
| 2021 | $725 | $16,160 | $6,680 | $9,480 |
| 2020 | $733 | $16,160 | $6,680 | $9,480 |
| 2019 | $688 | $13,700 | $5,660 | $8,040 |
| 2018 | $681 | $13,700 | $5,660 | $8,040 |
| 2017 | $659 | $13,700 | $5,660 | $8,040 |
| 2016 | $649 | $13,010 | $5,040 | $7,970 |
| 2015 | $637 | $13,010 | $5,040 | $7,970 |
| 2014 | $635 | $13,010 | $5,040 | $7,970 |
| 2012 | $613 | $13,400 | $5,190 | $8,210 |
Source: Public Records
Map
Nearby Homes