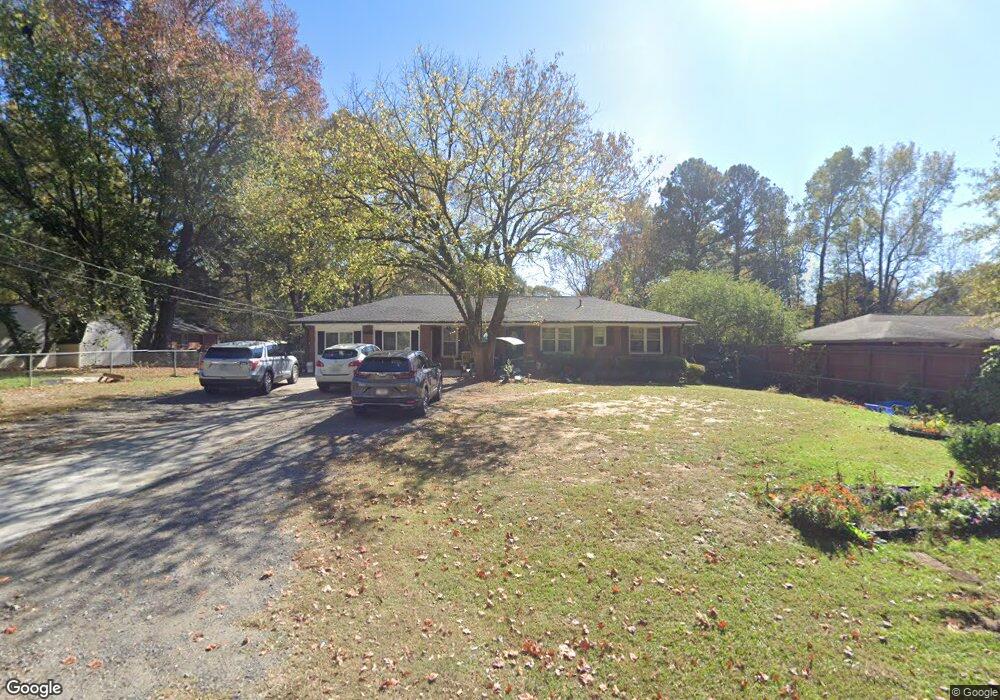
328 Crane Dr Unit 131A Lawrenceville, GA 30046
Estimated Value: $305,000 - $317,000
3
Beds
3
Baths
1,208
Sq Ft
$257/Sq Ft
Est. Value
About This Home
This home is located at 328 Crane Dr Unit 131A, Lawrenceville, GA 30046 and is currently estimated at $310,108, approximately $256 per square foot. 328 Crane Dr Unit 131A is a home located in Gwinnett County with nearby schools including Margaret Winn Holt Elementary School, Moore Middle School, and Central Gwinnett High School.
Ownership History
Date
Name
Owned For
Owner Type
Purchase Details
Closed on
May 17, 2019
Sold by
Golshir Johnathon M
Bought by
Shah Noor Bashar Bin Rabi
Current Estimated Value
Home Financials for this Owner
Home Financials are based on the most recent Mortgage that was taken out on this home.
Original Mortgage
$155,200
Outstanding Balance
$136,175
Interest Rate
4.1%
Mortgage Type
New Conventional
Estimated Equity
$173,933
Purchase Details
Closed on
Jul 18, 2006
Sold by
Mlmi Trust Series 2005-Wmc
Bought by
Golshir Jonathon M and Mcgee Julie
Home Financials for this Owner
Home Financials are based on the most recent Mortgage that was taken out on this home.
Original Mortgage
$113,000
Interest Rate
6.54%
Purchase Details
Closed on
May 2, 2006
Sold by
Mosley Kenneth J and Mosley Amanda N
Bought by
Mlmi Trust Series 2005-Wmc
Purchase Details
Closed on
May 26, 1995
Sold by
Raby Cecil T Barbara J
Bought by
White Stephen H
Create a Home Valuation Report for This Property
The Home Valuation Report is an in-depth analysis detailing your home's value as well as a comparison with similar homes in the area
Home Values in the Area
Average Home Value in this Area
Purchase History
| Date | Buyer | Sale Price | Title Company |
|---|---|---|---|
| Shah Noor Bashar Bin Rabi | $165,000 | -- | |
| Golshir Jonathon M | $111,100 | -- | |
| Mlmi Trust Series 2005-Wmc | $106,451 | -- | |
| White Stephen H | $69,500 | -- |
Source: Public Records
Mortgage History
| Date | Status | Borrower | Loan Amount |
|---|---|---|---|
| Open | Shah Noor Bashar Bin Rabi | $155,200 | |
| Previous Owner | Golshir Jonathon M | $113,000 | |
| Closed | White Stephen H | $0 |
Source: Public Records
Tax History Compared to Growth
Tax History
| Year | Tax Paid | Tax Assessment Tax Assessment Total Assessment is a certain percentage of the fair market value that is determined by local assessors to be the total taxable value of land and additions on the property. | Land | Improvement |
|---|---|---|---|---|
| 2024 | $3,381 | $110,480 | $22,400 | $88,080 |
| 2023 | $3,381 | $106,480 | $22,400 | $84,080 |
| 2022 | $3,151 | $101,480 | $18,400 | $83,080 |
| 2021 | $2,651 | $65,120 | $14,800 | $50,320 |
| 2020 | $2,436 | $58,840 | $12,000 | $46,840 |
| 2019 | $1,826 | $43,760 | $12,000 | $31,760 |
| 2018 | $1,745 | $41,600 | $9,200 | $32,400 |
| 2016 | $1,511 | $34,400 | $8,000 | $26,400 |
| 2015 | $1,377 | $30,120 | $6,400 | $23,720 |
| 2014 | $1,213 | $25,360 | $6,400 | $18,960 |
Source: Public Records
Map
Nearby Homes
- 338 Crane Dr
- 0 Black Oak Ct Unit 10046037
- 398 Lockridge Ln
- 429 Crane Dr
- 927 Winding Trail
- 210 Simonton Rd SW
- 200 Simonton Rd SW
- 499 Oak Way
- 990 Grayson Hwy
- 999 Chestnut Oak Ct
- 857 Pin Oak Way
- 760 Brand Trail S
- 234 Park Place Dr Unit 1
- 396 Windsor Farms Dr
- 257 Forest Lake Rd
- 313 Summit Ridge Dr
- 562 Plantation Blvd
- 722 Thornapple Trail
- 328 Crane Dr
- 795 Grayson Hwy
- 807 Grayson Hwy
- 348 Crane Dr
- 327 Black Oak Ct
- 337 Black Oak Ct Unit 6
- 811 Grayson Hwy
- NA Crane
- 319 Crane Dr
- 347 Black Oak Ct
- 358 Crane Dr
- 815 Grayson Hwy
- 309 Crane Dr
- 357 Black Oak Ct Unit 6
- 368 Crane Dr
- 367 Black Oak Ct
- 745 Grayson Hwy
- 326 Black Oak Ct
- 821 Grayson Hwy
- 336 Black Oak Ct Unit 6