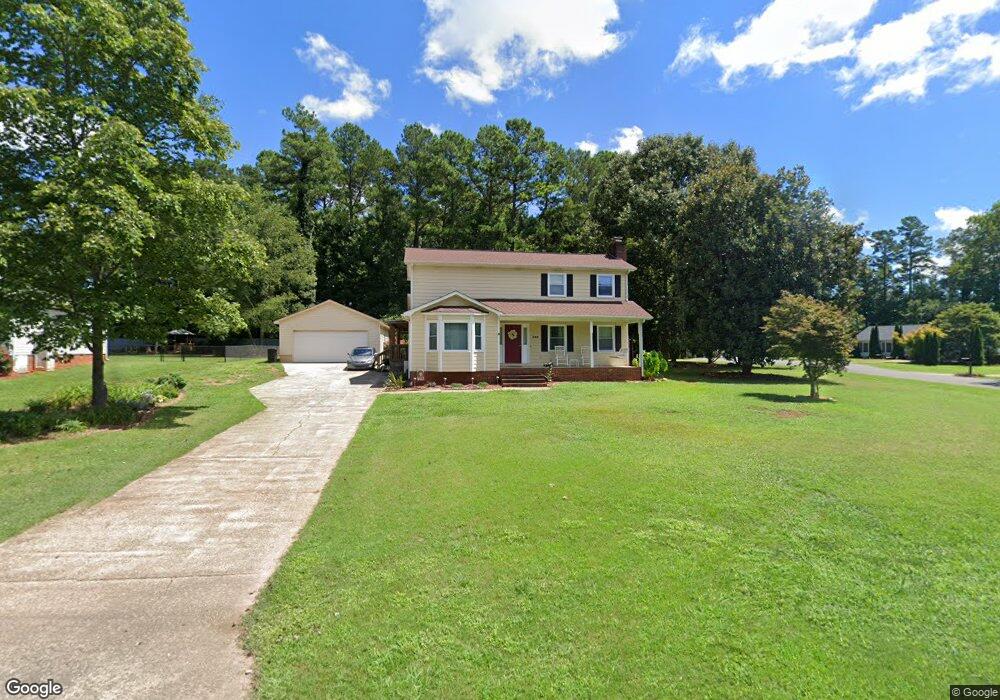
328 Deep Forest Ct Gastonia, NC 28056
Estimated Value: $332,000 - $363,000
3
Beds
2
Baths
1,661
Sq Ft
$207/Sq Ft
Est. Value
About This Home
This home is located at 328 Deep Forest Ct, Gastonia, NC 28056 and is currently estimated at $344,614, approximately $207 per square foot. 328 Deep Forest Ct is a home located in Gaston County with nearby schools including New Hope Elementary School, Cramerton Middle School, and Forestview High School.
Ownership History
Date
Name
Owned For
Owner Type
Purchase Details
Closed on
Aug 16, 2012
Sold by
Hall Annette
Bought by
Hall George L
Current Estimated Value
Purchase Details
Closed on
Apr 16, 2007
Sold by
Ruiz Ascencion S
Bought by
Ruiz Sharon Harris
Purchase Details
Closed on
Nov 30, 2005
Sold by
Watts William Wood
Bought by
Hall George L and Hall Annette
Home Financials for this Owner
Home Financials are based on the most recent Mortgage that was taken out on this home.
Original Mortgage
$138,000
Outstanding Balance
$76,061
Interest Rate
6.04%
Mortgage Type
Fannie Mae Freddie Mac
Estimated Equity
$268,553
Purchase Details
Closed on
May 12, 2003
Sold by
Craig Charles B and Craig Donna G
Bought by
Ruiz Ascencion S and Ruiz Sharon Harris
Home Financials for this Owner
Home Financials are based on the most recent Mortgage that was taken out on this home.
Original Mortgage
$41,400
Interest Rate
5.86%
Mortgage Type
Purchase Money Mortgage
Create a Home Valuation Report for This Property
The Home Valuation Report is an in-depth analysis detailing your home's value as well as a comparison with similar homes in the area
Purchase History
We collect this data history from publicly available records. To have your information removed, we recommend requesting removal directly through your county’s website.
| Date | Buyer | Sale Price | Title Company |
|---|---|---|---|
| Hall George L | -- | None Available | |
| Ruiz Sharon Harris | -- | None Available | |
| Hall George L | $138,000 | -- | |
| Ruiz Ascencion S | $42,000 | -- |
Source: Public Records
Mortgage History
We collect this data history from publicly available records. To have your information removed, we recommend requesting removal directly through your county’s website.
| Date | Status | Borrower | Loan Amount |
|---|---|---|---|
| Open | Hall George L | $138,000 | |
| Previous Owner | Ruiz Ascencion S | $41,400 |
Source: Public Records
Tax History
| Year | Tax Paid | Tax Assessment Tax Assessment Total Assessment is a certain percentage of the fair market value that is determined by local assessors to be the total taxable value of land and additions on the property. | Land | Improvement |
|---|---|---|---|---|
| 2025 | $2,094 | $293,300 | $25,000 | $268,300 |
| 2024 | $2,094 | $293,300 | $25,000 | $268,300 |
| 2023 | $2,038 | $293,300 | $25,000 | $268,300 |
| 2022 | $1,575 | $171,160 | $22,500 | $148,660 |
| 2021 | $1,587 | $171,160 | $22,500 | $148,660 |
| 2019 | $1,582 | $171,160 | $22,500 | $148,660 |
| 2018 | $1,411 | $145,477 | $21,200 | $124,277 |
| 2017 | $1,394 | $145,477 | $21,200 | $124,277 |
| 2016 | $1,394 | $145,477 | $0 | $0 |
| 2014 | $1,474 | $155,117 | $26,500 | $128,617 |
Source: Public Records
Map
Nearby Homes
- 4709 Mcdade Ln
- 4612 Poinsettia Ave
- 4631 Christina Ct
- 5424 Old Town Ln
- 5625 Weavers Row
- 5441 Grayson Ridge Ct
- 213 Stowe Rd
- 119 Hollifield St
- 3825 Quay Ct
- 3200 Beaty Rd
- 209 Vanguard Ln Unit 17
- 209 Vanguard Ln
- 201 Vanguard Ln Unit 13
- 211 Vanguard Ln
- 203 Vanguard Ln Unit 14
- 213 Ledford Dr
- 5073 Patton Dr
- 5056 Patton Dr
- 5021 Patton Dr
- 2020 Cramer Place Ct
- 332 Deep Forest Ct
- 336 Deep Forest Ct
- 205 Glenmore Ct
- 340 Deep Forest Ct
- 331 Deep Forest Ct
- 335 Deep Forest Ct
- 208 Glenmore Ct
- 327 Deep Forest Ct
- 204 Glenmore Ct
- 324 Deep Forest Ct
- 4701 Smt Vw Ct
- 4704 Smt Vw Ct
- 6003 Rosemore Ln
- 6002 Rosemore Ln
- 319 Deep Forest Ct
- 344 Deep Forest Ct
- 4712 Smt Vw Ct
- 320 Deep Forest Ct
- 6010 Rosemore Ln
- 4709 Smt Vw Ct
Your Personal Tour Guide
Ask me questions while you tour the home.