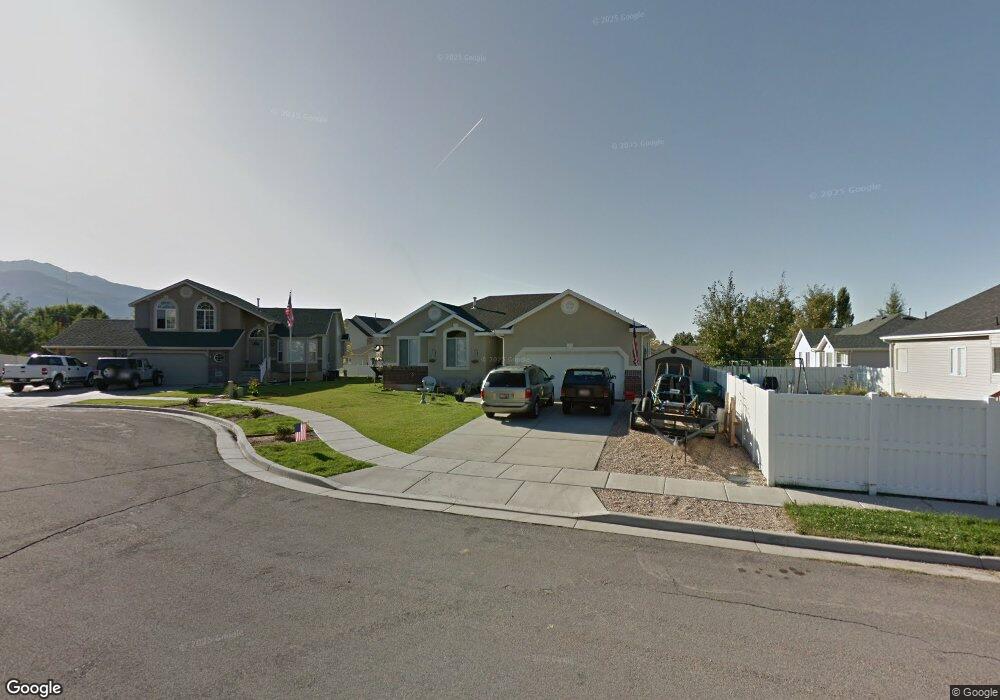
328 E 1525 N Layton, UT 84041
Estimated Value: $474,958 - $580,000
3
Beds
2
Baths
2,636
Sq Ft
$196/Sq Ft
Est. Value
About This Home
This home is located at 328 E 1525 N, Layton, UT 84041 and is currently estimated at $516,740, approximately $196 per square foot. 328 E 1525 N is a home located in Davis County with nearby schools including Lincoln Elementary School, North Layton Junior High School, and Northridge High School.
Ownership History
Date
Name
Owned For
Owner Type
Purchase Details
Closed on
Jul 25, 2025
Sold by
Olsen Mark
Bought by
Mark Clarke Olsen Trust and Olsen
Current Estimated Value
Purchase Details
Closed on
Sep 14, 2017
Sold by
Blakley Allison
Bought by
Olsen Mark and Olsen Cathleen
Purchase Details
Closed on
Jun 24, 2009
Sold by
Knudson Allison and Blakley Allison
Bought by
Blakley Allison
Home Financials for this Owner
Home Financials are based on the most recent Mortgage that was taken out on this home.
Original Mortgage
$195,579
Interest Rate
4.83%
Mortgage Type
FHA
Purchase Details
Closed on
Jan 2, 2004
Sold by
Perry Homes Inc
Bought by
Knudson Allison
Home Financials for this Owner
Home Financials are based on the most recent Mortgage that was taken out on this home.
Original Mortgage
$169,795
Interest Rate
5.81%
Mortgage Type
Purchase Money Mortgage
Create a Home Valuation Report for This Property
The Home Valuation Report is an in-depth analysis detailing your home's value as well as a comparison with similar homes in the area
Home Values in the Area
Average Home Value in this Area
Purchase History
| Date | Buyer | Sale Price | Title Company |
|---|---|---|---|
| Mark Clarke Olsen Trust | -- | None Listed On Document | |
| Mark Clarke Olsen Trust | -- | None Listed On Document | |
| Olsen Mark | -- | -- | |
| Blakley Allison | -- | Bonneville Superior | |
| Knudson Allison | -- | Meridian Title Company | |
| Perry Homes Inc | -- | Meridian Title Company |
Source: Public Records
Mortgage History
| Date | Status | Borrower | Loan Amount |
|---|---|---|---|
| Previous Owner | Blakley Allison | $195,579 | |
| Previous Owner | Knudson Allison | $169,795 |
Source: Public Records
Tax History
| Year | Tax Paid | Tax Assessment Tax Assessment Total Assessment is a certain percentage of the fair market value that is determined by local assessors to be the total taxable value of land and additions on the property. | Land | Improvement |
|---|---|---|---|---|
| 2025 | $2,264 | $237,600 | $104,074 | $133,526 |
| 2024 | $2,159 | $228,250 | $121,448 | $106,802 |
| 2023 | $2,151 | $401,000 | $139,109 | $261,891 |
| 2022 | $2,358 | $238,700 | $73,071 | $165,629 |
| 2021 | $2,180 | $329,000 | $101,243 | $227,757 |
| 2020 | $1,968 | $285,000 | $85,715 | $199,285 |
| 2019 | $1,946 | $276,000 | $81,892 | $194,108 |
| 2018 | $1,763 | $251,000 | $81,892 | $169,108 |
| 2016 | $1,638 | $120,340 | $25,821 | $94,519 |
| 2015 | $1,565 | $109,120 | $25,821 | $83,299 |
| 2014 | $1,588 | $113,207 | $25,821 | $87,386 |
| 2013 | -- | $108,032 | $31,103 | $76,929 |
Source: Public Records
Map
Nearby Homes
Your Personal Tour Guide
Ask me questions while you tour the home.