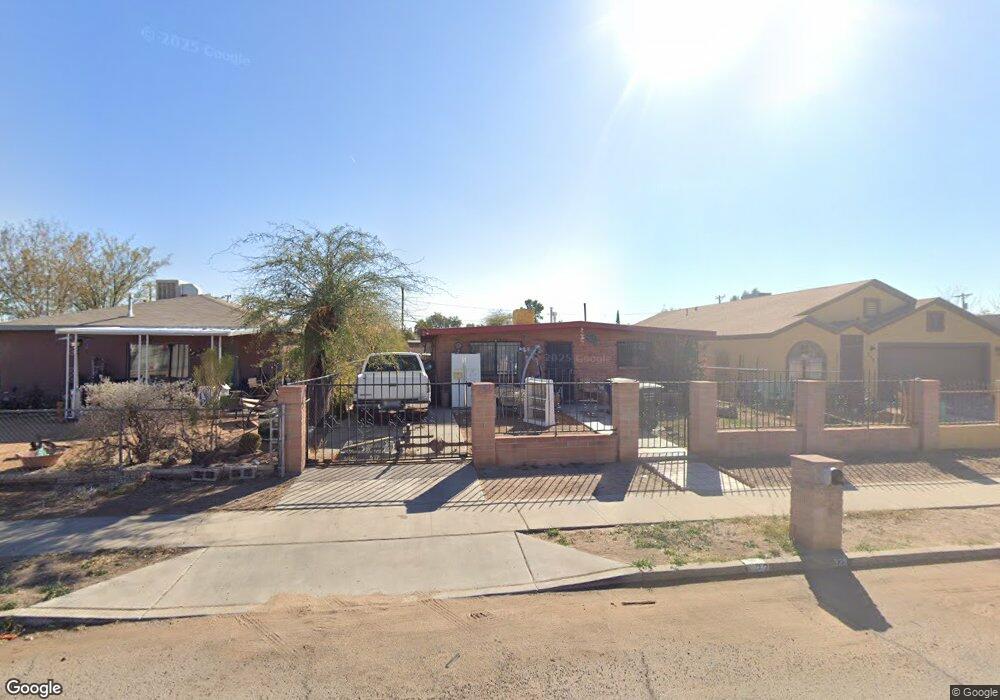
328 E 31st St Tucson, AZ 85713
Estimated Value: $172,000 - $269,000
Studio
2
Baths
1,230
Sq Ft
$185/Sq Ft
Est. Value
About This Home
This home is located at 328 E 31st St, Tucson, AZ 85713 and is currently estimated at $227,000, approximately $184 per square foot. 328 E 31st St is a home located in Pima County with nearby schools including Holladay Magnet School, Utterback Middle School, and Pueblo High Magnet School.
Ownership History
Date
Name
Owned For
Owner Type
Purchase Details
Closed on
Mar 8, 2002
Sold by
Castro Oscar H and Morales Esperanza G
Bought by
Angulo Esperanza G and Angulo Albert G
Current Estimated Value
Purchase Details
Closed on
Nov 22, 1996
Sold by
Castro Oscar H
Bought by
Castro Oscar H and Morales Esperanza G
Home Financials for this Owner
Home Financials are based on the most recent Mortgage that was taken out on this home.
Original Mortgage
$61,207
Interest Rate
7.88%
Mortgage Type
FHA
Purchase Details
Closed on
Nov 8, 1996
Sold by
Commonwealth Mtg Company
Bought by
Castro Oscar H
Home Financials for this Owner
Home Financials are based on the most recent Mortgage that was taken out on this home.
Original Mortgage
$61,207
Interest Rate
7.88%
Mortgage Type
FHA
Purchase Details
Closed on
May 30, 1995
Sold by
Maclean Rosalie P
Bought by
Arvayo Reyes David and Figueroa Reina
Create a Home Valuation Report for This Property
The Home Valuation Report is an in-depth analysis detailing your home's value as well as a comparison with similar homes in the area
Home Values in the Area
Average Home Value in this Area
Purchase History
| Date | Buyer | Sale Price | Title Company |
|---|---|---|---|
| Angulo Esperanza G | $65,000 | -- | |
| Castro Oscar H | -- | -- | |
| Castro Oscar H | $61,500 | -- | |
| Arvayo Reyes David | -- | -- | |
| Maclean Rosalie P | -- | -- |
Source: Public Records
Mortgage History
| Date | Status | Borrower | Loan Amount |
|---|---|---|---|
| Previous Owner | Castro Oscar H | $61,207 |
Source: Public Records
Tax History
| Year | Tax Paid | Tax Assessment Tax Assessment Total Assessment is a certain percentage of the fair market value that is determined by local assessors to be the total taxable value of land and additions on the property. | Land | Improvement |
|---|---|---|---|---|
| 2026 | $709 | $10,596 | -- | -- |
| 2025 | $709 | $10,091 | -- | -- |
| 2024 | $561 | $9,611 | -- | -- |
| 2023 | $512 | $9,153 | $0 | $0 |
| 2022 | $499 | $8,717 | $0 | $0 |
| 2021 | $494 | $3,860 | $0 | $0 |
| 2020 | $462 | $7,907 | $0 | $0 |
| 2019 | $439 | $10,042 | $0 | $0 |
| 2018 | $403 | $6,830 | $0 | $0 |
| 2017 | $368 | $6,830 | $0 | $0 |
| 2016 | $341 | $6,505 | $0 | $0 |
| 2015 | $311 | $6,195 | $0 | $0 |
Source: Public Records
Map
Nearby Homes
Your Personal Tour Guide
Ask me questions while you tour the home.