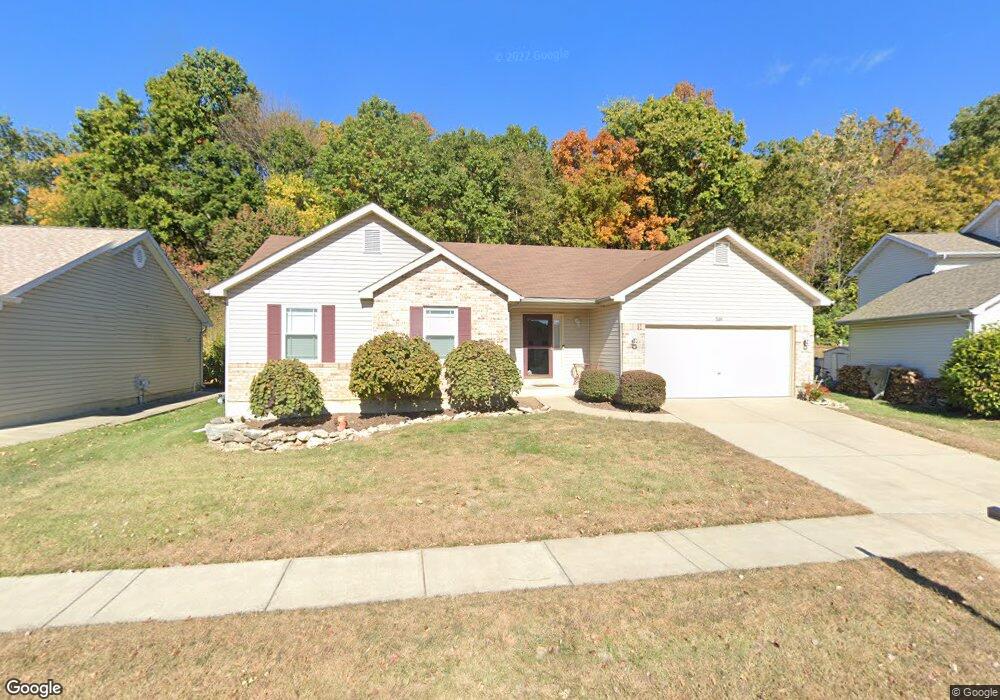
328 Keystone Dr Fenton, MO 63026
Estimated Value: $328,289 - $375,000
Studio
--
Bath
1,460
Sq Ft
$244/Sq Ft
Est. Value
About This Home
This home is located at 328 Keystone Dr, Fenton, MO 63026 and is currently estimated at $356,322, approximately $244 per square foot. 328 Keystone Dr is a home located in Jefferson County with nearby schools including George Guffey Elementary School, Ridgewood Middle School, and Fox Senior High School.
Ownership History
Date
Name
Owned For
Owner Type
Purchase Details
Closed on
May 17, 2005
Sold by
Sutton Dianne M C and Sutton William C
Bought by
Hunt Floyd B and Hunt Carol A
Current Estimated Value
Home Financials for this Owner
Home Financials are based on the most recent Mortgage that was taken out on this home.
Original Mortgage
$177,600
Outstanding Balance
$84,276
Interest Rate
4.75%
Mortgage Type
Fannie Mae Freddie Mac
Estimated Equity
$272,046
Purchase Details
Closed on
Aug 8, 2002
Sold by
Ahrens Virginia J
Bought by
Ahrens Virginia J C and Ahrens William C
Purchase Details
Closed on
Jun 23, 1999
Sold by
Charles F Vatterott Construction Co
Bought by
Ahrens William C and Ahrens Virginia J
Home Financials for this Owner
Home Financials are based on the most recent Mortgage that was taken out on this home.
Original Mortgage
$82,500
Interest Rate
7.21%
Create a Home Valuation Report for This Property
The Home Valuation Report is an in-depth analysis detailing your home's value as well as a comparison with similar homes in the area
Home Values in the Area
Average Home Value in this Area
Purchase History
| Date | Buyer | Sale Price | Title Company |
|---|---|---|---|
| Hunt Floyd B | -- | U S Title Guaranty Company | |
| Ahrens Virginia J C | -- | -- | |
| Ahrens William C | -- | Commonwealth Title |
Source: Public Records
Mortgage History
| Date | Status | Borrower | Loan Amount |
|---|---|---|---|
| Open | Hunt Floyd B | $177,600 | |
| Previous Owner | Ahrens William C | $82,500 |
Source: Public Records
Tax History
| Year | Tax Paid | Tax Assessment Tax Assessment Total Assessment is a certain percentage of the fair market value that is determined by local assessors to be the total taxable value of land and additions on the property. | Land | Improvement |
|---|---|---|---|---|
| 2025 | $2,792 | $43,300 | $9,600 | $33,700 |
| 2024 | $2,792 | $38,100 | $7,700 | $30,400 |
| 2023 | $2,792 | $38,100 | $7,700 | $30,400 |
| 2022 | $2,583 | $35,200 | $4,800 | $30,400 |
| 2021 | $2,582 | $35,200 | $4,800 | $30,400 |
| 2020 | $2,478 | $31,800 | $4,200 | $27,600 |
| 2019 | $2,480 | $31,800 | $4,200 | $27,600 |
| 2018 | $2,473 | $31,800 | $4,200 | $27,600 |
| 2017 | $2,398 | $31,800 | $4,200 | $27,600 |
| 2016 | $2,207 | $29,400 | $4,000 | $25,400 |
| 2015 | $2,134 | $29,400 | $4,000 | $25,400 |
| 2013 | -- | $28,900 | $4,000 | $24,900 |
Source: Public Records
Map
Nearby Homes
- 175 Keystone Dr
- 689 Fox Creek Dr
- 990 Hydeaway Ct
- 1053 Big Sky Dr
- 802 Fox Creek Dr
- 652 Green Jade Dr Unit H
- 651 Green Jade Dr Unit G
- 164 Hartford Ct
- 1 River Bend Dr
- 1137 Big Sky Dr
- 105 Lavernel Dr
- 2449 S Old Highway 141
- 60 Stonecliff Dr
- 819 Horizon Ln
- 711 Turnbridge Dr
- 316 Winding Bluffs Ct
- 414 Winding Bluffs Ct
- 13721 La Conte Ct Unit 3
- 396 Winding Bluffs Ct
- 1519 Winding Meadows Dr
- 324 Keystone Dr
- 332 Keystone Dr
- 320 Keystone Dr
- 329 Keystone Dr
- 325 Keystone Dr
- 336 Keystone Dr
- 335 Keystone Dr
- 316 Keystone Dr
- 321 Keystone Dr
- 340 Keystone Dr
- 341 Keystone Dr
- 317 Keystone Dr
- 312 Keystone Dr
- 344 Keystone Dr
- 313 Keystone Dr
- 345 Keystone Dr
- 32 Keystone Ct
- 28 Keystone Ct
- 348 Keystone Dr
- 309 Keystone Dr
Your Personal Tour Guide
Ask me questions while you tour the home.