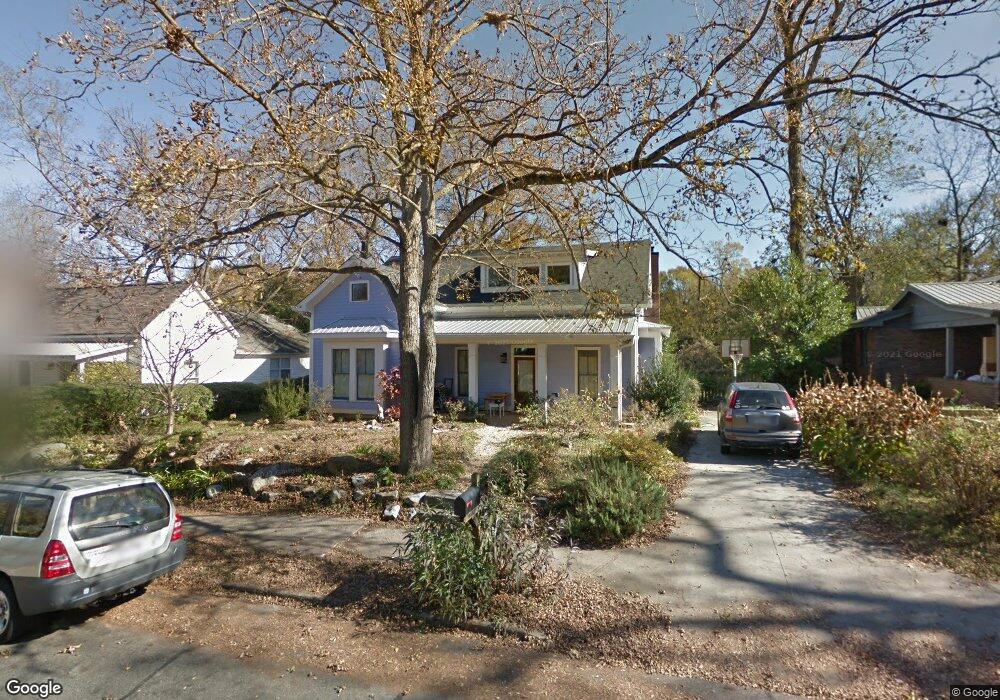
328 Lyndon Ave Athens, GA 30601
Boulevard NeighborhoodEstimated Value: $904,058 - $983,000
4
Beds
3
Baths
2,549
Sq Ft
$366/Sq Ft
Est. Value
About This Home
This home is located at 328 Lyndon Ave, Athens, GA 30601 and is currently estimated at $932,515, approximately $365 per square foot. 328 Lyndon Ave is a home with nearby schools including Johnnie Lay Burks Elementary School, Clarke Middle School, and Clarke Central High School.
Ownership History
Date
Name
Owned For
Owner Type
Purchase Details
Closed on
Apr 29, 2011
Sold by
J W York Properties Llc
Bought by
Austin Frances T
Current Estimated Value
Home Financials for this Owner
Home Financials are based on the most recent Mortgage that was taken out on this home.
Original Mortgage
$301,485
Outstanding Balance
$201,803
Interest Rate
4.25%
Mortgage Type
FHA
Estimated Equity
$730,712
Purchase Details
Closed on
Oct 25, 2010
Sold by
John Willis Homes Inc
Bought by
J W York Properties Llc
Home Financials for this Owner
Home Financials are based on the most recent Mortgage that was taken out on this home.
Original Mortgage
$288,524
Interest Rate
4.38%
Mortgage Type
Unknown
Purchase Details
Closed on
Mar 21, 2008
Sold by
Holt Jefferson
Bought by
John Willis Homes Inc
Purchase Details
Closed on
May 31, 2006
Sold by
Not Provided
Bought by
Austin Frances T
Purchase Details
Closed on
Oct 17, 1996
Sold by
Brinkley Addie G and Brooks Clifford L
Bought by
Holt Jefferson
Create a Home Valuation Report for This Property
The Home Valuation Report is an in-depth analysis detailing your home's value as well as a comparison with similar homes in the area
Home Values in the Area
Average Home Value in this Area
Purchase History
| Date | Buyer | Sale Price | Title Company |
|---|---|---|---|
| Austin Frances T | $335,000 | -- | |
| J W York Properties Llc | $130,000 | -- | |
| John Willis Homes Inc | -- | -- | |
| Austin Frances T | $120,000 | -- | |
| Holt Jefferson | -- | -- |
Source: Public Records
Mortgage History
| Date | Status | Borrower | Loan Amount |
|---|---|---|---|
| Open | J W York Properties Llc | $301,485 | |
| Previous Owner | J W York Properties Llc | $288,524 |
Source: Public Records
Tax History
| Year | Tax Paid | Tax Assessment Tax Assessment Total Assessment is a certain percentage of the fair market value that is determined by local assessors to be the total taxable value of land and additions on the property. | Land | Improvement |
|---|---|---|---|---|
| 2025 | $10,365 | $363,430 | $65,000 | $298,430 |
| 2024 | $10,365 | $314,442 | $60,000 | $254,442 |
| 2023 | $9,327 | $292,714 | $55,000 | $237,714 |
| 2022 | $7,454 | $243,654 | $55,000 | $188,654 |
| 2021 | $7,371 | $228,711 | $55,000 | $173,711 |
| 2020 | $7,080 | $220,092 | $55,000 | $165,092 |
| 2019 | $6,502 | $201,529 | $50,000 | $151,529 |
| 2018 | $6,047 | $188,111 | $45,000 | $143,111 |
| 2017 | $5,888 | $183,434 | $45,000 | $138,434 |
| 2016 | $5,475 | $171,274 | $45,000 | $126,274 |
| 2015 | $5,207 | $163,123 | $45,000 | $118,123 |
| 2014 | $4,747 | $149,396 | $40,000 | $109,396 |
Source: Public Records
Map
Nearby Homes
- 570 Prince Ave
- 947 N Chase St
- 524 Hill St
- 923 Hill St
- 100 Prince Ave Unit A404
- 100 Prince Ave Unit A407
- 390 Athens Ave
- 668 Pulaski St
- 1196 W Hancock Ave Unit 1
- 1198 W West Hancock Ave W
- 600 Pulaski St
- 189 Glenhaven Ave
- 271 King Ave
- 458 Dearing St
- 860 College Ave
- 940 College Ave
- 1398 W Hancock Ave
- 330 Pineneedle Rd
- 800 College Ave
- 269 N Hull St Unit 212
Your Personal Tour Guide
Ask me questions while you tour the home.