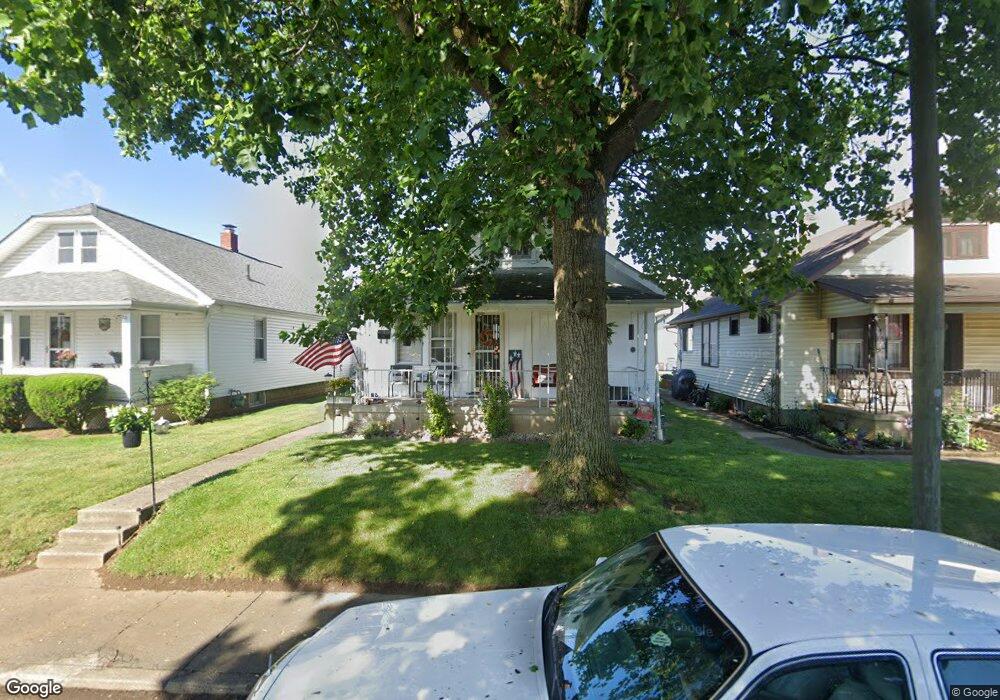
328 Massie Ave Chillicothe, OH 45601
Estimated Value: $99,000 - $142,000
2
Beds
1
Bath
816
Sq Ft
$145/Sq Ft
Est. Value
About This Home
This home is located at 328 Massie Ave, Chillicothe, OH 45601 and is currently estimated at $118,331, approximately $145 per square foot. 328 Massie Ave is a home located in Ross County with nearby schools including Chillicothe High School, Bishop Flaget School, and Wesley Taylor Preparatory School.
Ownership History
Date
Name
Owned For
Owner Type
Purchase Details
Closed on
Aug 19, 2020
Sold by
Violet Robert W
Bought by
Collett Billie Jo
Current Estimated Value
Home Financials for this Owner
Home Financials are based on the most recent Mortgage that was taken out on this home.
Original Mortgage
$82,968
Outstanding Balance
$73,461
Interest Rate
2.9%
Mortgage Type
FHA
Estimated Equity
$44,870
Purchase Details
Closed on
Feb 27, 2015
Sold by
Wright Angela L
Bought by
Violet Robert W
Purchase Details
Closed on
Jul 30, 2007
Sold by
Sheets May E
Bought by
Wright Angela L
Create a Home Valuation Report for This Property
The Home Valuation Report is an in-depth analysis detailing your home's value as well as a comparison with similar homes in the area
Home Values in the Area
Average Home Value in this Area
Purchase History
| Date | Buyer | Sale Price | Title Company |
|---|---|---|---|
| Collett Billie Jo | $84,500 | Northwest Title | |
| Violet Robert W | $35,000 | Title First Agency Inc | |
| Wright Angela L | $50,000 | None Available |
Source: Public Records
Mortgage History
| Date | Status | Borrower | Loan Amount |
|---|---|---|---|
| Open | Collett Billie Jo | $82,968 |
Source: Public Records
Tax History Compared to Growth
Tax History
| Year | Tax Paid | Tax Assessment Tax Assessment Total Assessment is a certain percentage of the fair market value that is determined by local assessors to be the total taxable value of land and additions on the property. | Land | Improvement |
|---|---|---|---|---|
| 2024 | $568 | $14,260 | $2,870 | $11,390 |
| 2023 | $568 | $14,260 | $2,870 | $11,390 |
| 2022 | $579 | $14,260 | $2,870 | $11,390 |
| 2021 | $602 | $13,000 | $2,570 | $10,430 |
| 2020 | $616 | $13,000 | $2,570 | $10,430 |
| 2019 | $616 | $13,000 | $2,570 | $10,430 |
| 2018 | $669 | $13,370 | $2,570 | $10,800 |
| 2017 | $720 | $13,370 | $2,570 | $10,800 |
| 2016 | $714 | $13,370 | $2,570 | $10,800 |
| 2015 | $674 | $12,310 | $2,570 | $9,740 |
| 2014 | $1,136 | $21,160 | $2,570 | $18,590 |
| 2013 | $1,137 | $21,160 | $2,570 | $18,590 |
Source: Public Records
Map
Nearby Homes