Estimated Value: $294,291 - $325,000
3
Beds
2
Baths
1,326
Sq Ft
$234/Sq Ft
Est. Value
About This Home
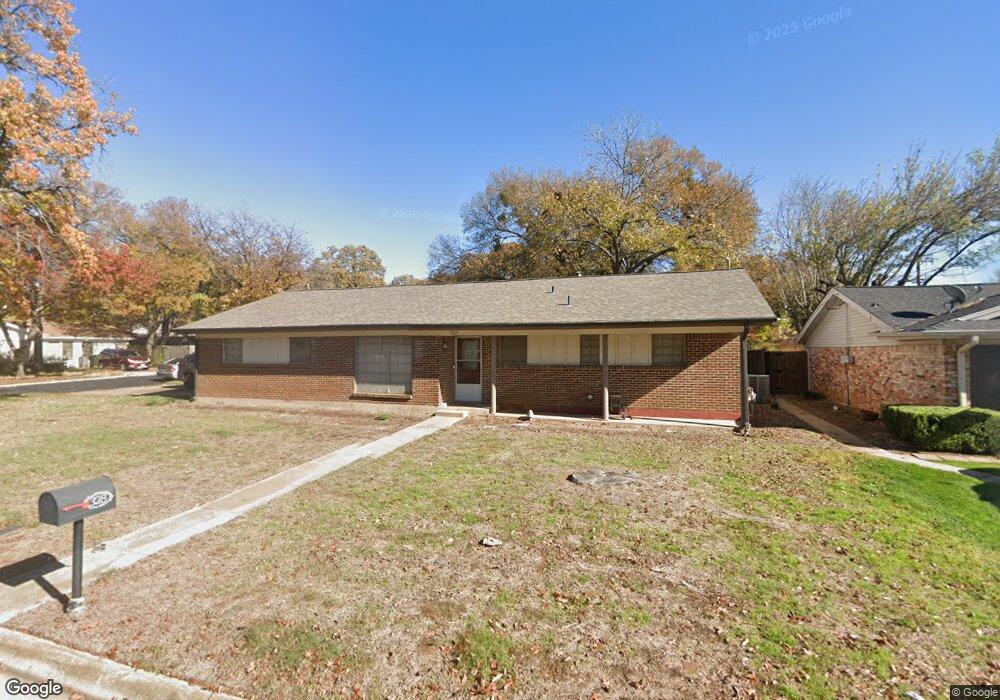
This home is located at 328 Moore Creek Rd, Hurst, TX 76053 and is currently estimated at $309,646, approximately $233 per square foot. 328 Moore Creek Rd is a home located in Tarrant County with nearby schools including Hurst Hills Elementary School, Hurst J High School, and L.D. Bell High School.
Ownership History
Date
Name
Owned For
Owner Type
Purchase Details
Closed on
Jan 28, 2022
Sold by
Brian Springs Larry and Brian Renee Donna
Bought by
Wilson Elicia Marie and Wilson Mark E
Current Estimated Value
Home Financials for this Owner
Home Financials are based on the most recent Mortgage that was taken out on this home.
Original Mortgage
$284,747
Outstanding Balance
$263,333
Interest Rate
3.22%
Mortgage Type
New Conventional
Estimated Equity
$46,313
Purchase Details
Closed on
Feb 29, 1996
Sold by
Warren Bufford Riley
Bought by
Springs Larry Brian and Springs Donna Renee
Home Financials for this Owner
Home Financials are based on the most recent Mortgage that was taken out on this home.
Original Mortgage
$60,800
Interest Rate
7.01%
Purchase Details
Closed on
Nov 17, 1995
Sold by
Eichman Shirley Janice Warren
Bought by
Warren Bufford Riley
Create a Home Valuation Report for This Property
The Home Valuation Report is an in-depth analysis detailing your home's value as well as a comparison with similar homes in the area
Home Values in the Area
Average Home Value in this Area
Purchase History
| Date | Buyer | Sale Price | Title Company |
|---|---|---|---|
| Wilson Elicia Marie | -- | New Title Company Name | |
| Wilson Elicia Marie | $378,713 | New Title Company Name | |
| Springs Larry Brian | -- | Trinity Western Title Co | |
| Warren Bufford Riley | -- | Trinity Western Title Co |
Source: Public Records
Mortgage History
| Date | Status | Borrower | Loan Amount |
|---|---|---|---|
| Open | Wilson Elicia Marie | $284,747 | |
| Closed | Wilson Elicia Marie | $284,747 | |
| Previous Owner | Springs Larry Brian | $60,800 | |
| Closed | Wilson Elicia Marie | $11,389 |
Source: Public Records
Tax History
| Year | Tax Paid | Tax Assessment Tax Assessment Total Assessment is a certain percentage of the fair market value that is determined by local assessors to be the total taxable value of land and additions on the property. | Land | Improvement |
|---|---|---|---|---|
| 2025 | $6,359 | $284,000 | $56,160 | $227,840 |
| 2024 | $6,359 | $311,318 | $56,160 | $255,158 |
| 2023 | $5,238 | $261,464 | $46,800 | $214,664 |
| 2022 | $4,585 | $240,895 | $46,800 | $194,095 |
| 2021 | $4,366 | $221,395 | $50,000 | $171,395 |
| 2020 | $3,960 | $177,361 | $50,000 | $127,361 |
| 2019 | $3,662 | $179,696 | $50,000 | $129,696 |
| 2018 | $2,789 | $136,015 | $25,000 | $111,015 |
| 2017 | $3,129 | $149,869 | $25,000 | $124,869 |
| 2016 | $2,845 | $134,622 | $25,000 | $109,622 |
| 2015 | $2,049 | $104,803 | $25,000 | $79,803 |
| 2014 | $2,049 | $92,900 | $20,000 | $72,900 |
Source: Public Records
Map
Nearby Homes
- 324 Moore Creek Rd
- 808 Betty Ct
- 852 W Redbud Dr
- 780 Betty Ln
- 800 Treadwell Ct Unit 800B
- 753 Cullum Ave
- 408 Simmons Dr
- 416 Simmons Dr
- 512 Billie Ruth Ln
- 637 Post Oak Dr
- 758 Briarwood Ln
- 756 Briarwood Ln
- 420 Twin Creek Dr
- 540 Billie Ruth Ln
- 712 Pine St
- 608 W Redbud Dr
- 623 Ridgeline Dr
- 3216 Fountain Pkwy
- 1208 Harris Ave
- 655 Ridgeline Dr
- 817 Henson Dr
- 400 Moore Creek Rd
- 329 Moore Creek Rd
- 816 Henson Dr
- 325 Moore Creek Rd
- 813 Henson Dr
- 316 Moore Creek Rd
- 404 Moore Creek Rd
- 401 Moore Creek Rd
- 812 Henson Dr
- 321 Moore Creek Rd
- 809 Henson Dr
- 408 Moore Creek Rd
- 405 Moore Creek Rd
- 808 Henson Dr
- 317 Moore Creek Rd
- 328 Carnation Ln
- 312 Moore Creek Rd
- 324 Carnation Ln
- 817 Ruth Ln
Your Personal Tour Guide
Ask me questions while you tour the home.