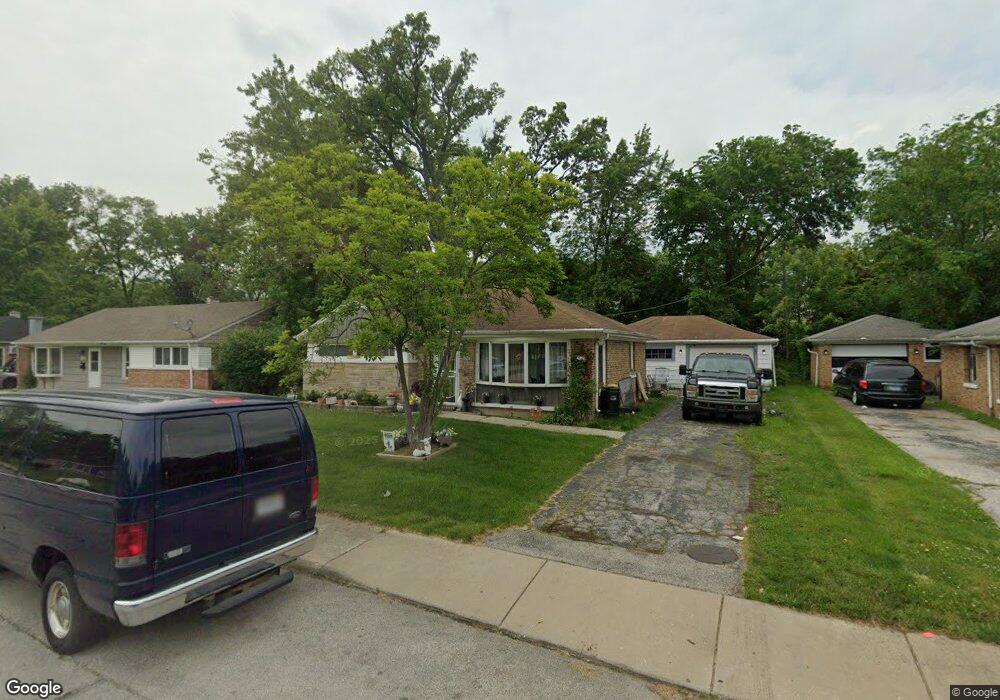
328 Osage St Park Forest, IL 60466
Estimated Value: $107,000 - $125,000
2
Beds
1
Bath
950
Sq Ft
$122/Sq Ft
Est. Value
About This Home
This home is located at 328 Osage St, Park Forest, IL 60466 and is currently estimated at $116,328, approximately $122 per square foot. 328 Osage St is a home located in Cook County with nearby schools including Blackhawk Intermediate Center, 21st Century Primary Center, and Michelle Obama School of Technology.
Ownership History
Date
Name
Owned For
Owner Type
Purchase Details
Closed on
Mar 20, 2023
Sold by
Castle Ridge Builders Llc
Bought by
Harris Dwayne
Current Estimated Value
Home Financials for this Owner
Home Financials are based on the most recent Mortgage that was taken out on this home.
Original Mortgage
$80,750
Outstanding Balance
$78,587
Interest Rate
7%
Mortgage Type
New Conventional
Estimated Equity
$37,741
Purchase Details
Closed on
Jan 9, 2012
Sold by
Secretary Of Housing & Urban Development
Bought by
Castle Ridge Builders Llc
Purchase Details
Closed on
May 13, 2011
Sold by
Gholson Dein
Bought by
The Secretary Of Housing & Urban Develop
Purchase Details
Closed on
May 3, 2005
Sold by
Mb Financial Bank Na
Bought by
Gholson Dein and Stegall Elvina R
Home Financials for this Owner
Home Financials are based on the most recent Mortgage that was taken out on this home.
Original Mortgage
$88,511
Interest Rate
5.91%
Mortgage Type
FHA
Create a Home Valuation Report for This Property
The Home Valuation Report is an in-depth analysis detailing your home's value as well as a comparison with similar homes in the area
Home Values in the Area
Average Home Value in this Area
Purchase History
| Date | Buyer | Sale Price | Title Company |
|---|---|---|---|
| Harris Dwayne | $85,000 | First American Title | |
| Castle Ridge Builders Llc | -- | Stewart Title Company | |
| The Secretary Of Housing & Urban Develop | -- | None Available | |
| Gholson Dein | $90,000 | Pntn |
Source: Public Records
Mortgage History
| Date | Status | Borrower | Loan Amount |
|---|---|---|---|
| Open | Harris Dwayne | $80,750 | |
| Previous Owner | Gholson Dein | $88,511 |
Source: Public Records
Tax History Compared to Growth
Tax History
| Year | Tax Paid | Tax Assessment Tax Assessment Total Assessment is a certain percentage of the fair market value that is determined by local assessors to be the total taxable value of land and additions on the property. | Land | Improvement |
|---|---|---|---|---|
| 2024 | $8,051 | $10,047 | $2,663 | $7,384 |
| 2023 | $4,636 | $11,000 | $2,663 | $8,337 |
| 2022 | $4,636 | $3,449 | $2,473 | $976 |
| 2021 | $4,549 | $3,448 | $2,472 | $976 |
| 2020 | $4,148 | $3,448 | $2,472 | $976 |
| 2019 | $4,976 | $4,572 | $2,282 | $2,290 |
| 2018 | $5,894 | $5,619 | $2,282 | $3,337 |
| 2017 | $5,858 | $5,619 | $2,282 | $3,337 |
| 2016 | $4,568 | $4,595 | $2,092 | $2,503 |
| 2015 | $2,517 | $5,214 | $2,092 | $3,122 |
| 2014 | $2,495 | $5,214 | $2,092 | $3,122 |
| 2013 | $2,690 | $5,813 | $2,092 | $3,721 |
Source: Public Records
Map
Nearby Homes