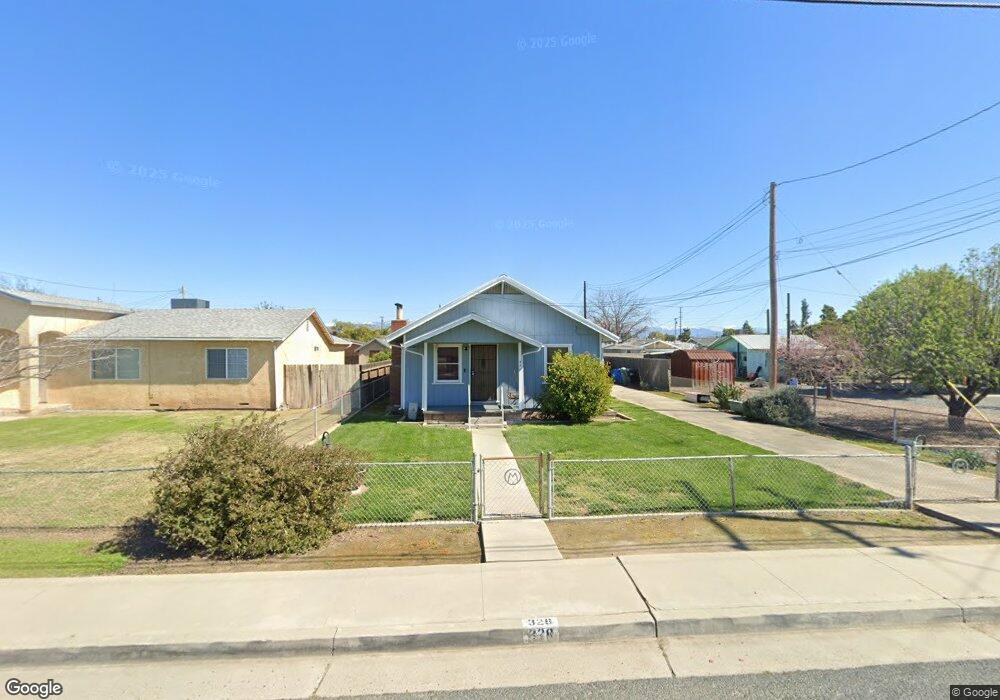
328 Patsy St Porterville, CA 93257
Porterville Northwest NeighborhoodEstimated Value: $218,000 - $276,771
About This Home
This home is located at 328 Patsy St, Porterville, CA 93257 and is currently estimated at $242,193, approximately $263 per square foot. 328 Patsy St is a home located in Tulare County with nearby schools including Burton Elementary School, Burton Middle School, and Porterville High School.
Ownership History
We collect this data history from publicly available records. To have your information removed, we recommend requesting removal directly through your county’s website.
Purchase Details
Home Financials for this Owner
Home Financials are based on the most recent Mortgage that was taken out on this home.Purchase Details
Home Values in the Area
Average Home Value in this Area
Purchase History
We collect this data history from publicly available records. To have your information removed, we recommend requesting removal directly through your county’s website.
| Date | Buyer | Sale Price | Title Company |
|---|---|---|---|
| $140,000 | First American Title Company | ||
| -- | -- |
Mortgage History
We collect this data history from publicly available records. To have your information removed, we recommend requesting removal directly through your county’s website.
| Date | Status | Borrower | Loan Amount |
|---|---|---|---|
| Open | $137,464 |
Tax History
We collect this data history from publicly available records. To have your information removed, we recommend requesting removal directly through your county’s website.
| Year | Tax Paid | Tax Assessment Tax Assessment Total Assessment is a certain percentage of the fair market value that is determined by local assessors to be the total taxable value of land and additions on the property. | Land | Improvement |
|---|---|---|---|---|
| 2025 | $1,592 | $151,538 | $37,884 | $113,654 |
| 2024 | $1,592 | $148,568 | $37,142 | $111,426 |
| 2023 | $1,596 | $145,656 | $36,414 | $109,242 |
| 2022 | $1,507 | $142,800 | $35,700 | $107,100 |
| 2021 | $1,512 | $140,000 | $35,000 | $105,000 |
| 2020 | $225 | $27,997 | $7,839 | $20,158 |
| 2019 | $223 | $27,448 | $7,685 | $19,763 |
| 2018 | $212 | $26,909 | $7,534 | $19,375 |
| 2017 | $207 | $26,381 | $7,386 | $18,995 |
| 2016 | $196 | $25,864 | $7,241 | $18,623 |
| 2015 | $186 | $25,475 | $7,132 | $18,343 |
| 2014 | $186 | $24,976 | $6,992 | $17,984 |
Map
- 790 Rose Ln
- 1634 W Morton Ave
- 370 Lindale St
- 1620 W Grand Ave
- 572 N Verdugo Dr
- 635 N Belmont St
- 1343 W Morton Ave Unit Sp 84
- 141 N Waukesha St
- 208 N Lombardi St
- 1425 W Henderson Ave
- 2013 W Cricklewood Ct
- 471 S Belmont St
- 640 Piccadilly Ln
- 640 N Prospect St
- 474 Douglas St
- 283 S Parkwest St
- 700 N Prospect St
- 100 S Westwood St Unit 15
- 100 S Westwood St Unit 20
- 100 S Westwood St Unit 92
Ask me questions while you tour the home.