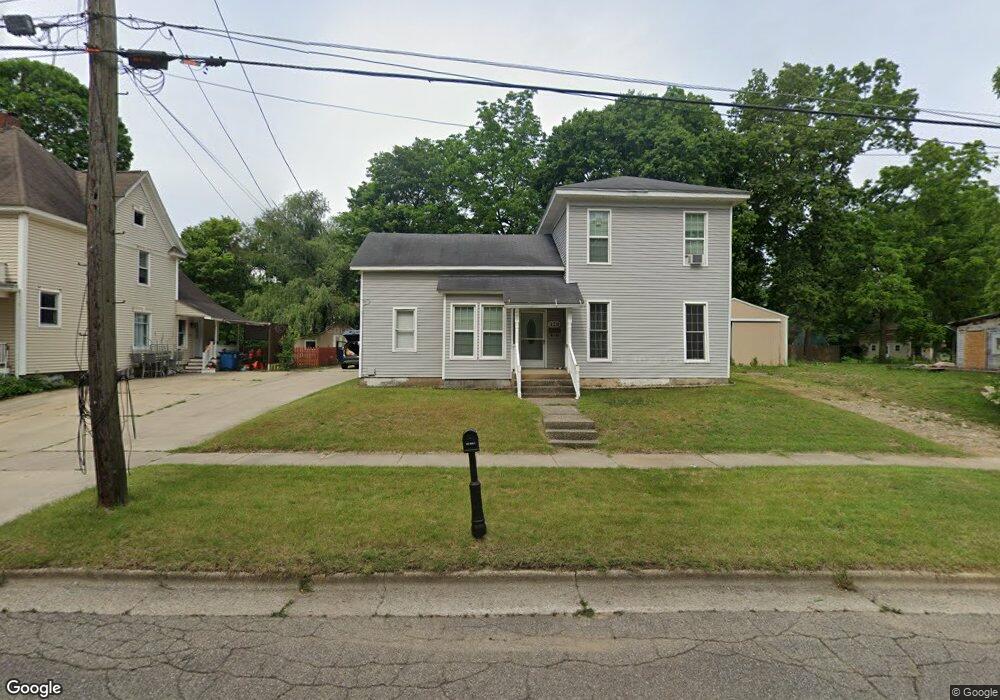
328 S Cedar St Allegan, MI 49010
Estimated Value: $224,000 - $253,000
3
Beds
1
Bath
2,225
Sq Ft
$105/Sq Ft
Est. Value
About This Home
This home is located at 328 S Cedar St, Allegan, MI 49010 and is currently estimated at $233,250, approximately $104 per square foot. 328 S Cedar St is a home located in Allegan County with nearby schools including West Ward Elementary School, L.E. White Middle School, and Allegan High School.
Ownership History
Date
Name
Owned For
Owner Type
Purchase Details
Closed on
Aug 26, 2011
Sold by
Fannie Mae
Bought by
Li Ling
Current Estimated Value
Purchase Details
Closed on
Jan 10, 2011
Sold by
Wells Fargo Bank Na
Bought by
Federal National Mortgage Association
Purchase Details
Closed on
Jan 6, 2011
Sold by
Vandam Keith and Vandam Cynthia
Bought by
Wells Fargo Bank Na
Purchase Details
Closed on
Jun 7, 1999
Sold by
Jernigan Earnest and Jernigan Debra
Bought by
Vandam Keith and Vandam Cynthia
Purchase Details
Closed on
Dec 1, 1997
Sold by
Jernigan Earnest Dale and Jernigan Debra
Bought by
Vandam Keith and Vandam Cynthia
Purchase Details
Closed on
Jul 26, 1996
Sold by
Van Dam
Bought by
Jernigan and Van Dam
Create a Home Valuation Report for This Property
The Home Valuation Report is an in-depth analysis detailing your home's value as well as a comparison with similar homes in the area
Home Values in the Area
Average Home Value in this Area
Purchase History
| Date | Buyer | Sale Price | Title Company |
|---|---|---|---|
| Li Ling | $26,200 | Parks Title | |
| Federal National Mortgage Association | -- | None Available | |
| Wells Fargo Bank Na | $82,570 | None Available | |
| Vandam Keith | $59,900 | -- | |
| Vandam Keith | $58,900 | -- | |
| Jernigan | -- | -- |
Source: Public Records
Tax History Compared to Growth
Tax History
| Year | Tax Paid | Tax Assessment Tax Assessment Total Assessment is a certain percentage of the fair market value that is determined by local assessors to be the total taxable value of land and additions on the property. | Land | Improvement |
|---|---|---|---|---|
| 2025 | $1,525 | $103,500 | $14,200 | $89,300 |
| 2024 | $1,388 | $89,900 | $12,300 | $77,600 |
| 2023 | $1,438 | $78,100 | $11,700 | $66,400 |
| 2022 | $1,388 | $69,300 | $9,700 | $59,600 |
| 2021 | $1,327 | $66,300 | $7,700 | $58,600 |
| 2020 | $1,308 | $48,200 | $7,100 | $41,100 |
| 2019 | $1,275 | $44,700 | $6,800 | $37,900 |
| 2018 | $1,225 | $33,900 | $6,600 | $27,300 |
| 2017 | $0 | $31,900 | $5,500 | $26,400 |
| 2016 | $0 | $27,300 | $4,600 | $22,700 |
| 2015 | -- | $27,300 | $4,600 | $22,700 |
| 2014 | -- | $29,000 | $4,600 | $24,400 |
| 2013 | $1,395 | $31,500 | $4,600 | $26,900 |
Source: Public Records
Map
Nearby Homes