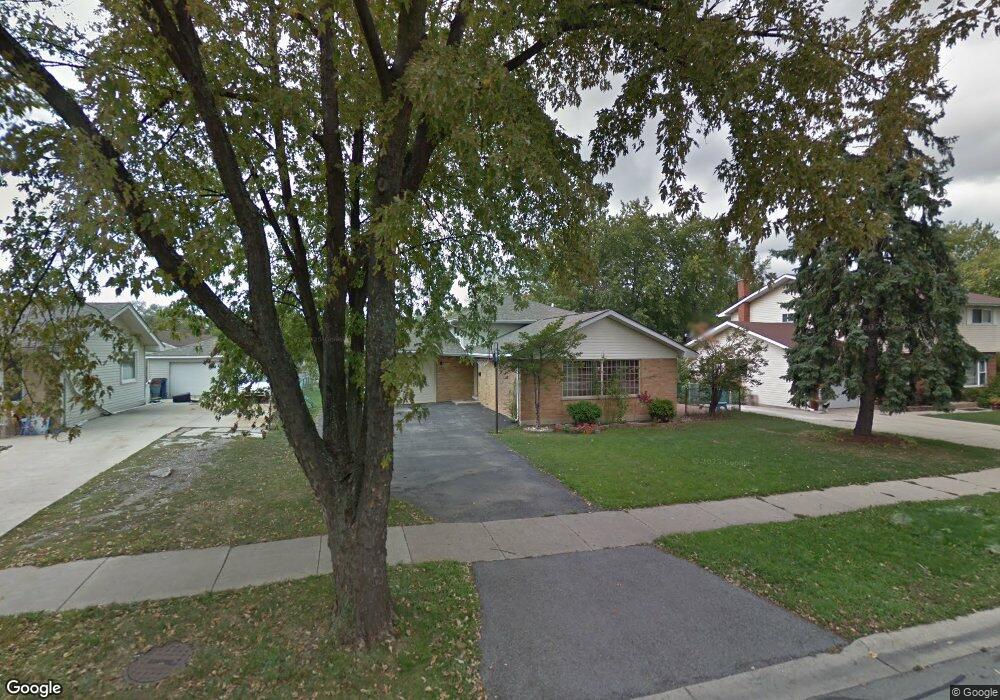
328 S Hale St Unit 3 Addison, IL 60101
Estimated Value: $321,000 - $359,000
3
Beds
2
Baths
1,249
Sq Ft
$273/Sq Ft
Est. Value
About This Home
This home is located at 328 S Hale St Unit 3, Addison, IL 60101 and is currently estimated at $340,467, approximately $272 per square foot. 328 S Hale St Unit 3 is a home located in DuPage County with nearby schools including Lake Park Elementary School, Indian Trail Jr High School, and Salmon Alternative School.
Ownership History
Date
Name
Owned For
Owner Type
Purchase Details
Closed on
Jan 4, 2020
Sold by
Cortes Patricia and Quiroga Vicente
Bought by
Cortes Patricia
Current Estimated Value
Purchase Details
Closed on
Sep 2, 2011
Sold by
Fannie Mae
Bought by
Cortes Patricia and Quiroga Vicente
Home Financials for this Owner
Home Financials are based on the most recent Mortgage that was taken out on this home.
Original Mortgage
$122,000
Outstanding Balance
$83,385
Interest Rate
4.22%
Mortgage Type
New Conventional
Estimated Equity
$257,082
Purchase Details
Closed on
Aug 27, 2010
Sold by
Russman Marcel
Bought by
Federal National Mortgage Association
Purchase Details
Closed on
Jul 31, 2006
Sold by
Kamal Anwar and Kamal Lubna
Bought by
Russmann Marcel
Home Financials for this Owner
Home Financials are based on the most recent Mortgage that was taken out on this home.
Original Mortgage
$208,800
Interest Rate
7.25%
Mortgage Type
New Conventional
Create a Home Valuation Report for This Property
The Home Valuation Report is an in-depth analysis detailing your home's value as well as a comparison with similar homes in the area
Home Values in the Area
Average Home Value in this Area
Purchase History
| Date | Buyer | Sale Price | Title Company |
|---|---|---|---|
| Cortes Patricia | -- | Attorney | |
| Cortes Patricia | $132,000 | Attorneys Title Guaranty Fun | |
| Federal National Mortgage Association | -- | None Available | |
| Russmann Marcel | $261,000 | Cst |
Source: Public Records
Mortgage History
| Date | Status | Borrower | Loan Amount |
|---|---|---|---|
| Open | Cortes Patricia | $122,000 | |
| Previous Owner | Russmann Marcel | $208,800 |
Source: Public Records
Tax History Compared to Growth
Tax History
| Year | Tax Paid | Tax Assessment Tax Assessment Total Assessment is a certain percentage of the fair market value that is determined by local assessors to be the total taxable value of land and additions on the property. | Land | Improvement |
|---|---|---|---|---|
| 2024 | $7,401 | $113,000 | $42,424 | $70,576 |
| 2023 | $7,058 | $103,880 | $39,000 | $64,880 |
| 2022 | $6,743 | $97,550 | $36,610 | $60,940 |
| 2021 | $6,458 | $93,440 | $35,070 | $58,370 |
| 2020 | $6,280 | $89,500 | $33,590 | $55,910 |
| 2019 | $6,234 | $86,060 | $32,300 | $53,760 |
| 2018 | $6,028 | $80,260 | $30,750 | $49,510 |
| 2017 | $5,869 | $76,710 | $29,390 | $47,320 |
| 2016 | $5,705 | $70,820 | $27,130 | $43,690 |
| 2015 | $5,555 | $65,420 | $25,060 | $40,360 |
| 2014 | $3,575 | $44,000 | $22,970 | $21,030 |
| 2013 | $5,494 | $66,920 | $23,440 | $43,480 |
Source: Public Records
Map
Nearby Homes
- 10 N Adams Dr
- 433 W Diversey Ave
- 200 Addison Rd
- 18 S Vista Ave
- 2 N Wisconsin Ave
- 305 E Normandy Dr
- 427 W Natoma Ave
- 625 S Yale Ave
- 539 W Rose Ave
- 621 W Natalie Ln
- 133 E Lake St
- 542 W Memory Ln
- 128 S Villa Ave
- 235 N Mill Rd Unit 115B
- 19W068 E North Ave
- 18W308 Sidney Ave
- 737 Saint Johns Place
- 437 E Lorraine Ave
- 257 Masters Dr
- 253 Masters Dr
- 270 W Fullerton Ave
- 324 S Hale St
- 332 S Hale St
- 256 W Fullerton Ave
- 320 S Hale St
- 336 S Hale St
- 329 S Hale St
- 325 S Hale St
- 210 W Fullerton Ave
- 323 S Hale St
- 316 S Hale St
- 340 S Hale St
- 201 W Lake Park Dr
- 335 Hale St
- 254 W Fullerton Ave Unit 258
- 254 W Fullerton Ave
- 254 W Fullerton Ave Unit 264
- 203 W Lake Park Dr
- 317 S Hale St
- 207 W Lake Park Dr Unit 2A