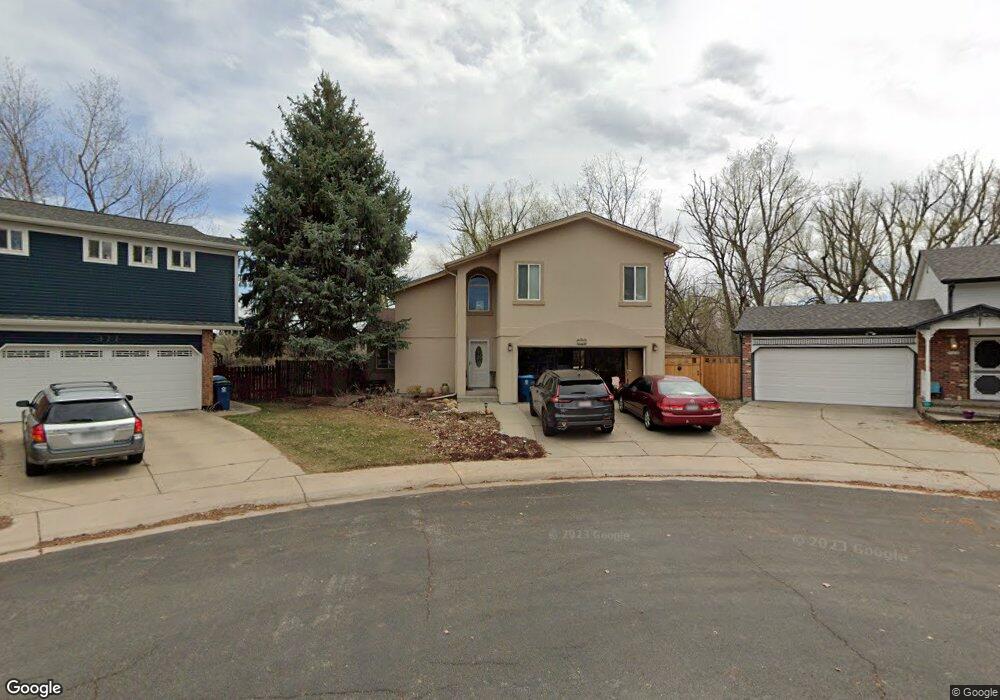
328 S Jefferson Ave Louisville, CO 80027
Estimated Value: $795,496 - $858,000
4
Beds
2
Baths
1,732
Sq Ft
$472/Sq Ft
Est. Value
About This Home
This home is located at 328 S Jefferson Ave, Louisville, CO 80027 and is currently estimated at $817,624, approximately $472 per square foot. 328 S Jefferson Ave is a home located in Boulder County with nearby schools including Louisville Elementary School, Louisville Middle School, and Monarch High School.
Ownership History
Date
Name
Owned For
Owner Type
Purchase Details
Closed on
Oct 27, 2016
Sold by
Hynan Particia A
Bought by
Follendorf Patricia A
Current Estimated Value
Purchase Details
Closed on
Feb 26, 1999
Sold by
Downing Gerk Warren S and Downing Darcy K
Bought by
Hynan Patricia A
Home Financials for this Owner
Home Financials are based on the most recent Mortgage that was taken out on this home.
Original Mortgage
$139,600
Interest Rate
7.25%
Purchase Details
Closed on
Apr 26, 1994
Sold by
Raley Mark Allen and Raley Dena Marling
Bought by
Gerk Warren S
Home Financials for this Owner
Home Financials are based on the most recent Mortgage that was taken out on this home.
Original Mortgage
$85,000
Interest Rate
7.71%
Purchase Details
Closed on
May 15, 1984
Bought by
Follendorf Patricia A
Purchase Details
Closed on
Nov 8, 1982
Bought by
Follendorf Patricia A
Create a Home Valuation Report for This Property
The Home Valuation Report is an in-depth analysis detailing your home's value as well as a comparison with similar homes in the area
Home Values in the Area
Average Home Value in this Area
Purchase History
| Date | Buyer | Sale Price | Title Company |
|---|---|---|---|
| Follendorf Patricia A | -- | None Available | |
| Follendore Patricia A | -- | None Available | |
| Hynan Patricia A | $174,500 | Land Title | |
| Gerk Warren S | $130,000 | -- | |
| Follendorf Patricia A | $82,500 | -- | |
| Follendorf Patricia A | $75,600 | -- |
Source: Public Records
Mortgage History
| Date | Status | Borrower | Loan Amount |
|---|---|---|---|
| Previous Owner | Hynan Patricia A | $139,600 | |
| Previous Owner | Gerk Warren S | $85,000 |
Source: Public Records
Tax History Compared to Growth
Tax History
| Year | Tax Paid | Tax Assessment Tax Assessment Total Assessment is a certain percentage of the fair market value that is determined by local assessors to be the total taxable value of land and additions on the property. | Land | Improvement |
|---|---|---|---|---|
| 2025 | $4,379 | $56,131 | $20,006 | $36,125 |
| 2024 | $4,379 | $56,131 | $20,006 | $36,125 |
| 2023 | $4,305 | $55,422 | $21,172 | $37,935 |
| 2022 | $3,536 | $43,695 | $15,874 | $27,821 |
| 2021 | $3,720 | $47,319 | $17,189 | $30,130 |
| 2020 | $3,358 | $43,029 | $16,159 | $26,870 |
| 2019 | $3,310 | $43,029 | $16,159 | $26,870 |
| 2018 | $2,745 | $37,930 | $9,288 | $28,642 |
| 2017 | $2,691 | $41,933 | $10,268 | $31,665 |
| 2016 | $2,373 | $34,929 | $10,826 | $24,103 |
| 2015 | $2,249 | $31,712 | $17,432 | $14,280 |
| 2014 | $2,711 | $31,712 | $17,432 | $14,280 |
Source: Public Records
Map
Nearby Homes
- 298 S Hoover Ave
- 111 Barbara St
- 503 Lois Dr
- 196 Lincoln Cir
- 203 Springs Dr
- 242 Clementina St
- 516 Grant Ave
- 380 County Rd
- 291 W Sycamore Ln
- TBD L12 County Rd 255
- TBD L14 County Rd 255
- TBD L2 County Rd 255
- TBD L8 County Rd 255
- 529 Main St
- 539 Coal Creek Ln
- 385 East St
- 549 Parbois Ln
- 415 East St
- 567 Manorwood Ln
- 625 Lombardi Cir
- 322 S Jefferson Ave
- 330 S Jefferson Ave
- 342 S Jefferson Ave
- 318 S Jefferson Ave
- 348 S Jefferson Ave
- 314 S Jefferson Ave
- 350 S Jefferson Ave
- 335 S Jefferson Ave
- 347 S Jefferson Ave
- 310 S Jefferson Ave
- 329 S Jefferson Ave
- 351 S Jefferson Ave
- 323 S Jefferson Ave
- 352 S Jefferson Ave
- 304 S Jefferson Ave
- 596 Juniper Ct
- 498 Lilac Ct
- 493 Lilac Ct
- 294 S Jefferson Ave
- 360 S Jefferson Ave