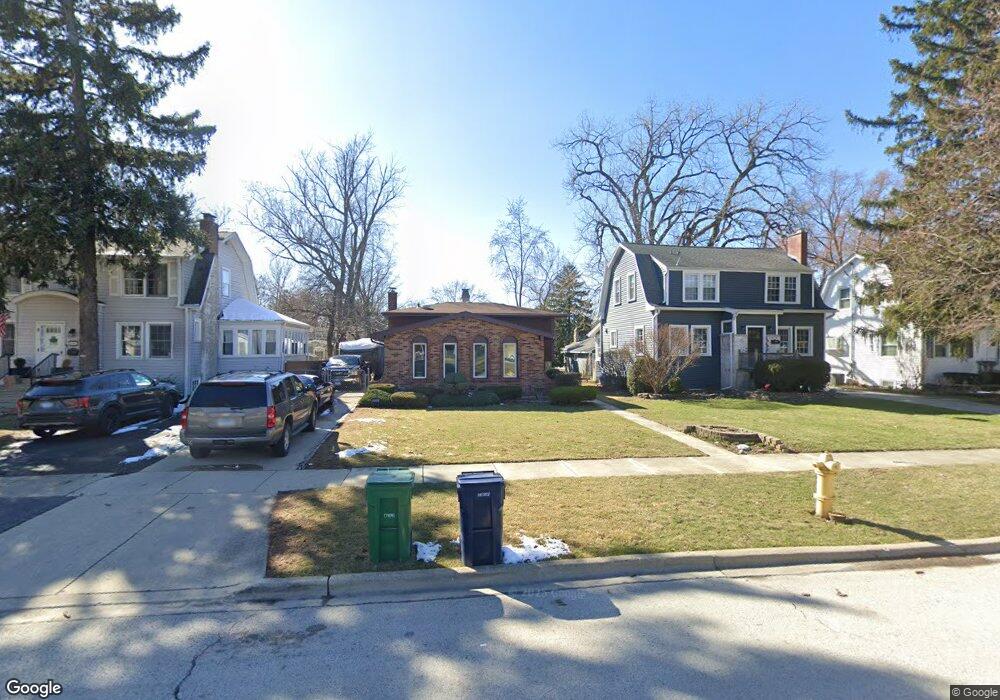
328 S Lewis Ave Lombard, IL 60148
North Lombard NeighborhoodEstimated Value: $378,387 - $479,000
--
Bed
--
Bath
1,387
Sq Ft
$309/Sq Ft
Est. Value
About This Home
This home is located at 328 S Lewis Ave, Lombard, IL 60148 and is currently estimated at $428,097, approximately $308 per square foot. 328 S Lewis Ave is a home located in DuPage County with nearby schools including Westmore Elementary School, Jackson Middle School, and Willowbrook High School.
Ownership History
Date
Name
Owned For
Owner Type
Purchase Details
Closed on
Jun 3, 1998
Sold by
Sylvester James W and Sylvester Debra M
Bought by
Priola Daniel M and Priola Rita M
Current Estimated Value
Home Financials for this Owner
Home Financials are based on the most recent Mortgage that was taken out on this home.
Original Mortgage
$131,000
Outstanding Balance
$26,824
Interest Rate
7.32%
Estimated Equity
$401,273
Purchase Details
Closed on
Feb 20, 1995
Sold by
Sylvester James W and Sylvester Debra M
Bought by
Sylvester James W and Sylvester Debra M
Purchase Details
Closed on
Dec 16, 1993
Sold by
Beale David W and Beale Annamarie
Bought by
Sylvester James W and Bellazzini Debbie M
Home Financials for this Owner
Home Financials are based on the most recent Mortgage that was taken out on this home.
Original Mortgage
$134,000
Interest Rate
7.25%
Create a Home Valuation Report for This Property
The Home Valuation Report is an in-depth analysis detailing your home's value as well as a comparison with similar homes in the area
Home Values in the Area
Average Home Value in this Area
Purchase History
| Date | Buyer | Sale Price | Title Company |
|---|---|---|---|
| Priola Daniel M | $176,000 | Premier Title Company | |
| Sylvester James W | -- | -- | |
| Sylvester James W | $150,000 | Attorneys Title Guaranty Fun |
Source: Public Records
Mortgage History
| Date | Status | Borrower | Loan Amount |
|---|---|---|---|
| Open | Priola Daniel M | $131,000 | |
| Previous Owner | Sylvester James W | $134,000 |
Source: Public Records
Tax History Compared to Growth
Tax History
| Year | Tax Paid | Tax Assessment Tax Assessment Total Assessment is a certain percentage of the fair market value that is determined by local assessors to be the total taxable value of land and additions on the property. | Land | Improvement |
|---|---|---|---|---|
| 2024 | $7,612 | $119,376 | $22,677 | $96,699 |
| 2023 | $7,206 | $110,390 | $20,970 | $89,420 |
| 2022 | $7,182 | $106,110 | $20,160 | $85,950 |
| 2021 | $6,927 | $103,470 | $19,660 | $83,810 |
| 2020 | $7,149 | $101,200 | $19,230 | $81,970 |
| 2019 | $6,730 | $96,210 | $18,280 | $77,930 |
| 2018 | $6,054 | $83,210 | $20,180 | $63,030 |
| 2017 | $5,901 | $79,290 | $19,230 | $60,060 |
| 2016 | $5,820 | $74,700 | $18,120 | $56,580 |
| 2015 | $5,541 | $69,590 | $16,880 | $52,710 |
| 2014 | $6,424 | $79,320 | $21,020 | $58,300 |
| 2013 | $6,326 | $80,440 | $21,320 | $59,120 |
Source: Public Records
Map
Nearby Homes
- 406 S Edgewood Ave
- 216 S Edgewood Ave
- 528 E Washington Blvd
- 415 S Highland Ave
- 208 S Highland Ave
- 125 S Chase Ave
- 328 S Grace St
- 634 E Emerson Ave
- 313 S Lombard Ave
- 118 S Highland Ave
- 82 S Lodge Ln
- 570 S Fairfield Ave
- 1041 E Division St
- 602 Arthur Dr
- 616 S Ahrens Ave
- 736 E Saint Charles Rd
- 935 E Saint Charles Rd
- 912 E Saint Charles Rd
- 610 Hammerschmidt Ave
- 107 S Charlotte St
- 332 S Lewis Ave
- 324 S Lewis Ave
- 338 S Lewis Ave
- 320 S Lewis Ave
- 327 S Edgewood Ave
- 340 S Lewis Ave
- 323 S Edgewood Ave
- 331 S Edgewood Ave
- 316 S Lewis Ave
- 337 S Edgewood Ave
- 321 S Edgewood Ave
- 342 S Lewis Ave
- 315 S Edgewood Ave
- 312 S Lewis Ave
- 339 S Edgewood Ave
- 331 S Lewis Ave
- 327 S Lewis Ave
- 339 S Lewis Ave
- 335 S Lewis Ave
- 323 S Lewis Ave