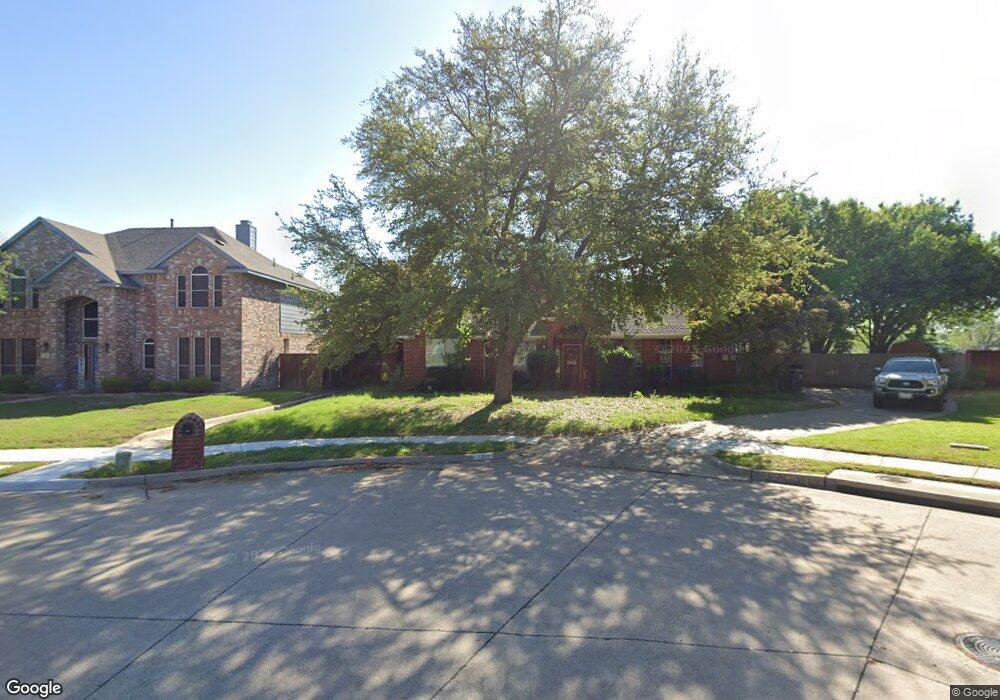
328 Shady Timbers Ln Murphy, TX 75094
Estimated Value: $444,000 - $508,000
3
Beds
2
Baths
2,015
Sq Ft
$234/Sq Ft
Est. Value
About This Home
This home is located at 328 Shady Timbers Ln, Murphy, TX 75094 and is currently estimated at $470,730, approximately $233 per square foot. 328 Shady Timbers Ln is a home located in Collin County with nearby schools including Miller Elementary School, Murphy Middle School, and C A Mcmillen High School.
Ownership History
Date
Name
Owned For
Owner Type
Purchase Details
Closed on
Jan 26, 2004
Sold by
Sanders Jeffery W
Bought by
Cozart Curtis and Cozart Christina
Current Estimated Value
Home Financials for this Owner
Home Financials are based on the most recent Mortgage that was taken out on this home.
Original Mortgage
$151,304
Outstanding Balance
$70,715
Interest Rate
5.78%
Mortgage Type
FHA
Estimated Equity
$400,015
Purchase Details
Closed on
May 17, 1999
Sold by
Carlson Steven D and Carlson Rebecca B
Bought by
Sanders Jeffrey W
Home Financials for this Owner
Home Financials are based on the most recent Mortgage that was taken out on this home.
Original Mortgage
$130,000
Interest Rate
6.94%
Purchase Details
Closed on
Oct 20, 1994
Sold by
Hampton Enterprises Inc
Bought by
Carlson Steven D and Carlson Rebecca B
Home Financials for this Owner
Home Financials are based on the most recent Mortgage that was taken out on this home.
Original Mortgage
$134,050
Interest Rate
8.73%
Create a Home Valuation Report for This Property
The Home Valuation Report is an in-depth analysis detailing your home's value as well as a comparison with similar homes in the area
Home Values in the Area
Average Home Value in this Area
Purchase History
| Date | Buyer | Sale Price | Title Company |
|---|---|---|---|
| Cozart Curtis | -- | -- | |
| Sanders Jeffrey W | -- | -- | |
| Carlson Steven D | -- | -- |
Source: Public Records
Mortgage History
| Date | Status | Borrower | Loan Amount |
|---|---|---|---|
| Open | Cozart Curtis | $151,304 | |
| Previous Owner | Sanders Jeffrey W | $130,000 | |
| Previous Owner | Carlson Steven D | $134,050 |
Source: Public Records
Tax History Compared to Growth
Tax History
| Year | Tax Paid | Tax Assessment Tax Assessment Total Assessment is a certain percentage of the fair market value that is determined by local assessors to be the total taxable value of land and additions on the property. | Land | Improvement |
|---|---|---|---|---|
| 2025 | $7,919 | $480,462 | $138,201 | $342,261 |
| 2024 | $7,919 | $484,168 | $138,201 | $345,967 |
| 2023 | $7,919 | $445,993 | $138,201 | $307,792 |
| 2022 | $7,714 | $393,878 | $120,175 | $273,703 |
| 2021 | $5,976 | $289,405 | $96,140 | $193,265 |
| 2020 | $5,969 | $285,814 | $84,123 | $201,691 |
| 2019 | $5,941 | $271,172 | $84,123 | $187,049 |
| 2018 | $6,059 | $274,031 | $84,123 | $189,908 |
| 2017 | $5,515 | $249,445 | $84,123 | $165,322 |
| 2016 | $5,386 | $240,582 | $72,105 | $168,477 |
| 2015 | $4,319 | $208,881 | $54,079 | $154,802 |
Source: Public Records
Map
Nearby Homes
- 237 Mimosa Dr
- 248 Mimosa Dr
- 202 Sweetgum Dr
- 524 Jasmine Dr
- 113 Birch Blvd
- Pampa Farmhouse Plan at Crescent Hill
- 110 Birch Blvd
- 465 Kinney Dr
- 600 E Fm 544
- LOT#2 S Maxwell Creek Rd
- 402 S Maxwell Creek Rd
- 322 Willow Wood St
- 342 Willow Wood St
- 356 Willow Wood St
- 602 Horizon Dr
- 5421 Palace Dr
- Lot#1 S Maxwell Creek Rd
- Grand Whitehall Plan at Lakes at Legacy
- Grand Heritage Plan at Lakes at Legacy
- Alexandria II Plan at Lakes at Legacy
- 232 Peach Tree Dr
- 324 Shady Timbers Ln
- 228 Peach Tree Dr
- 320 Shady Timbers Ln
- 329 Shady Timbers Ln
- 325 Shady Timbers Ln
- 224 Peach Tree Dr
- 316 Shady Timbers Ln
- 321 Shady Timbers Ln
- 328 Hawthorne Dr
- 220 Peach Tree Dr
- 312 Shady Timbers Ln
- 324 Hawthorne Dr
- 301 Mimosa Dr
- 249 Mimosa Dr
- 305 Mimosa Dr
- 317 Shady Timbers Ln
- 245 Mimosa Dr
- 309 Mimosa Dr
- 241 Mimosa Dr