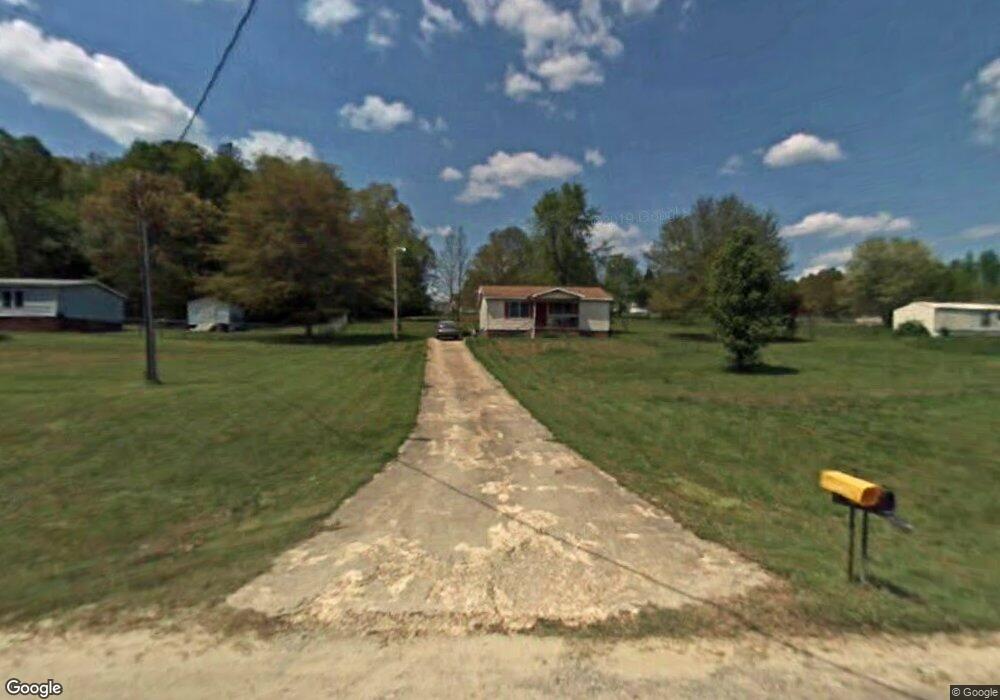
328 Southfork Meadows Rd Gastonia, NC 28052
Estimated Value: $148,000 - $162,000
2
Beds
2
Baths
816
Sq Ft
$191/Sq Ft
Est. Value
About This Home
This home is located at 328 Southfork Meadows Rd, Gastonia, NC 28052 and is currently estimated at $155,959, approximately $191 per square foot. 328 Southfork Meadows Rd is a home located in Gaston County with nearby schools including Chapel Grove Elementary School, Southwest Middle School, and Hunter Huss High School.
Ownership History
Date
Name
Owned For
Owner Type
Purchase Details
Closed on
Feb 7, 2024
Sold by
Correa Jennifer L and Correa Gilbert A
Bought by
Legrand Eric Riley
Current Estimated Value
Home Financials for this Owner
Home Financials are based on the most recent Mortgage that was taken out on this home.
Original Mortgage
$15,000
Outstanding Balance
$14,735
Interest Rate
6.62%
Estimated Equity
$141,224
Purchase Details
Closed on
Dec 15, 2023
Sold by
Hardy Wayne Lee
Bought by
Correa Jennifer L and Hardy Wayne Lee
Home Financials for this Owner
Home Financials are based on the most recent Mortgage that was taken out on this home.
Original Mortgage
$111,000
Outstanding Balance
$109,042
Interest Rate
6.62%
Mortgage Type
New Conventional
Estimated Equity
$46,917
Purchase Details
Closed on
Jul 16, 2003
Sold by
Hardy Dorothy E
Bought by
Hardy Wayne Lee
Create a Home Valuation Report for This Property
The Home Valuation Report is an in-depth analysis detailing your home's value as well as a comparison with similar homes in the area
Home Values in the Area
Average Home Value in this Area
Purchase History
| Date | Buyer | Sale Price | Title Company |
|---|---|---|---|
| Legrand Eric Riley | $120,000 | None Listed On Document | |
| Correa Jennifer L | -- | None Listed On Document | |
| Correa Jennifer L | -- | None Listed On Document | |
| Hardy Wayne Lee | -- | -- |
Source: Public Records
Mortgage History
| Date | Status | Borrower | Loan Amount |
|---|---|---|---|
| Open | Legrand Eric Riley | $15,000 | |
| Open | Legrand Eric Riley | $111,000 |
Source: Public Records
Tax History Compared to Growth
Tax History
| Year | Tax Paid | Tax Assessment Tax Assessment Total Assessment is a certain percentage of the fair market value that is determined by local assessors to be the total taxable value of land and additions on the property. | Land | Improvement |
|---|---|---|---|---|
| 2025 | $914 | $127,970 | $15,460 | $112,510 |
| 2024 | $914 | $127,970 | $15,460 | $112,510 |
| 2023 | $889 | $134,350 | $15,460 | $118,890 |
| 2022 | $520 | $56,560 | $13,530 | $43,030 |
| 2021 | $522 | $56,560 | $13,530 | $43,030 |
| 2019 | $528 | $56,560 | $13,530 | $43,030 |
| 2018 | $629 | $64,510 | $15,538 | $48,972 |
| 2017 | $629 | $64,510 | $15,538 | $48,972 |
| 2016 | $629 | $64,510 | $0 | $0 |
| 2014 | $683 | $70,771 | $19,035 | $51,736 |
Source: Public Records
Map
Nearby Homes
- 335 S Fork Meadows Rd
- 1520 Woodend Ln
- 5328 Oaktree Dr
- 1264 Lilly Dr Unit 21
- 953 Bollinger Pond Dr
- 5909 Crawford Rd
- 1500 Crowders Creek Rd
- 5438 Mallard Ln
- 5412 Mallard Ln
- Lot 2 Rhyne Rd
- 1430 Crowders Creek Rd
- 5108 Sawbill Ln
- 994 Rhyne Rd
- 1131 Colonial Rd
- 129 Hannaford Place
- Lot 3 Rhyne Rd
- 1040 Spring Dr
- 00 State Road S-46-883
- 110 Jeran Ln
- 5707 Lewis Rd
- 328 S Fork Meadows Rd
- 328 S Fork Dr
- 329 Southfork Meadows Rd
- 127 Twisted Oaks Ln
- 317 Southfork Meadows Rd
- 107 Twisted Oaks Ln
- 310 Southfork Meadows Rd
- 311 S Fork Meadows Rd
- 311 Southfork Meadows Rd
- 203 Woodcut Rd
- na Twisted Oak Ln
- 112 Twisted Oaks Ln
- 306 S Fork Meadows Rd
- 116 Twisted Oaks Ln
- 305 Southfork Meadows Rd
- 100 Twisted Oaks Ln
- 120 Twisted Oaks Ln
- 124 Twisted Oaks Ln
- 302 Southfork Meadows Rd Unit 53
- 302 Southfork Meadows Rd