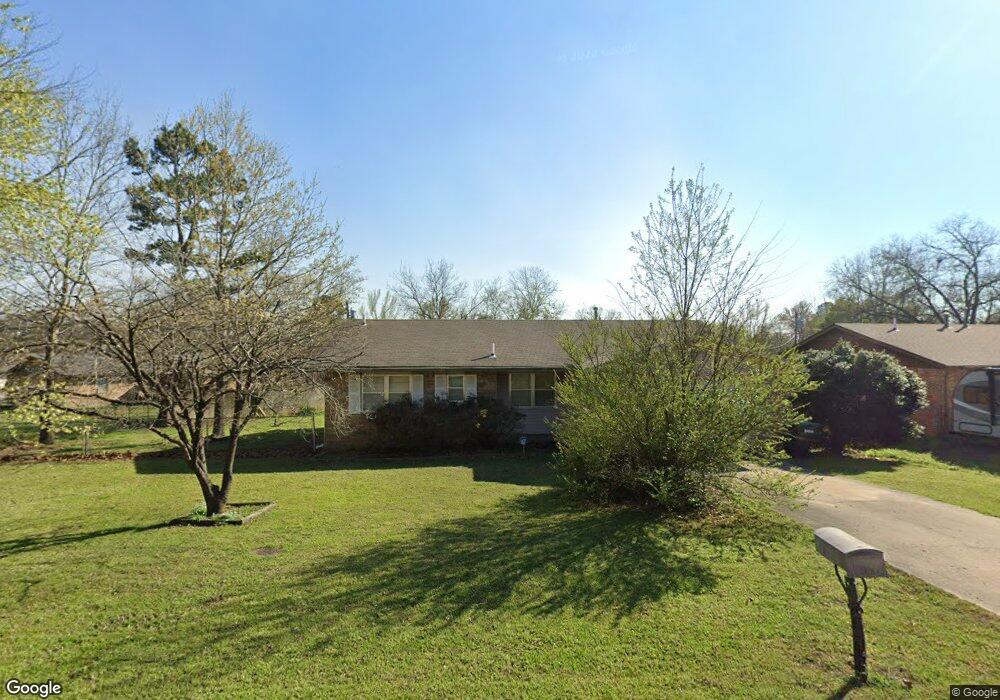
328 Tanglewood Dr Tahlequah, OK 74464
Estimated Value: $151,321 - $174,000
3
Beds
2
Baths
1,088
Sq Ft
$150/Sq Ft
Est. Value
About This Home
This home is located at 328 Tanglewood Dr, Tahlequah, OK 74464 and is currently estimated at $163,580, approximately $150 per square foot. 328 Tanglewood Dr is a home located in Cherokee County with nearby schools including Greenwood Elementary School, Cherokee Elementary School, and Tahlequah Middle School.
Ownership History
Date
Name
Owned For
Owner Type
Purchase Details
Closed on
Oct 27, 2011
Sold by
Willis Herbert and Willis Valerie
Bought by
Monroe Thomas H
Current Estimated Value
Home Financials for this Owner
Home Financials are based on the most recent Mortgage that was taken out on this home.
Original Mortgage
$95,204
Outstanding Balance
$65,027
Interest Rate
4.13%
Mortgage Type
New Conventional
Estimated Equity
$98,553
Purchase Details
Closed on
Sep 17, 2009
Sold by
Camero Clara L
Bought by
Willis Herbert and Willis Valerie
Home Financials for this Owner
Home Financials are based on the most recent Mortgage that was taken out on this home.
Original Mortgage
$98,727
Interest Rate
5.2%
Mortgage Type
New Conventional
Purchase Details
Closed on
Sep 12, 2002
Sold by
Kerri Wilkie
Bought by
Clara L Camero
Purchase Details
Closed on
Jan 27, 1999
Sold by
Freddie Faye Beck
Bought by
Kerri Wilkie
Create a Home Valuation Report for This Property
The Home Valuation Report is an in-depth analysis detailing your home's value as well as a comparison with similar homes in the area
Home Values in the Area
Average Home Value in this Area
Purchase History
| Date | Buyer | Sale Price | Title Company |
|---|---|---|---|
| Monroe Thomas H | $103,000 | None Available | |
| Willis Herbert | $100,000 | Heritage Title | |
| Clara L Camero | $87,500 | -- | |
| Kerri Wilkie | $55,000 | -- |
Source: Public Records
Mortgage History
| Date | Status | Borrower | Loan Amount |
|---|---|---|---|
| Open | Monroe Thomas H | $95,204 | |
| Previous Owner | Willis Herbert | $98,727 |
Source: Public Records
Tax History Compared to Growth
Tax History
| Year | Tax Paid | Tax Assessment Tax Assessment Total Assessment is a certain percentage of the fair market value that is determined by local assessors to be the total taxable value of land and additions on the property. | Land | Improvement |
|---|---|---|---|---|
| 2025 | $1,005 | $10,377 | $2,750 | $7,627 |
| 2024 | $1,005 | $10,612 | $2,728 | $7,884 |
| 2023 | $1,005 | $10,106 | $1,650 | $8,456 |
| 2022 | $938 | $10,106 | $1,650 | $8,456 |
| 2021 | $941 | $10,106 | $1,650 | $8,456 |
| 2020 | $958 | $10,107 | $1,650 | $8,457 |
| 2019 | $937 | $9,974 | $1,628 | $8,346 |
| 2018 | $903 | $9,499 | $825 | $8,674 |
| 2017 | $901 | $9,499 | $825 | $8,674 |
| 2016 | $881 | $9,227 | $825 | $8,402 |
| 2015 | $825 | $8,788 | $825 | $7,963 |
| 2014 | $1,066 | $11,330 | $880 | $10,450 |
Source: Public Records
Map
Nearby Homes
- 720 S East Ave
- 1005 Kaufman Ave
- 413 Greenwood Dr
- 1105 S Maple Ave
- 605 S Oak Ave
- 508 Covington Place
- 702 Wilson Ave
- 835 Blue Heron
- 725 Sooner Dr
- 201 Sandy Cir
- 952 Edgewater
- 1041 Edgewater
- 306 Short St
- 1065 Edgewater
- 104 Tommye Ln
- 757 S Bluff Ave
- 215 S Maple Ave
- 857 Crestview
- 403 S Bluff Ave
- 848 Crestview
- 912 S East Ave
- 910 S East Ave
- 914 S East Ave
- 324 Tanglewood Dr
- 323 Redbud Ln
- 329 Tanglewood Dr
- 327 Tanglewood Dr
- 331 Tanglewood Dr
- 325 Redbud Ln
- 906 S East Ave
- 24138 S 508 Rd
- 681 Bois Darc
- 691 Bois Darc
- 690 Bois Darc
- 22790 Sunrise Ridge Dr
- 616 Kingston Place
- 601 Kingston Place
- 22790 Sunrise Ridge Dr
- 642 Kingston Place
- 22718 Sunrise Ridge Dr