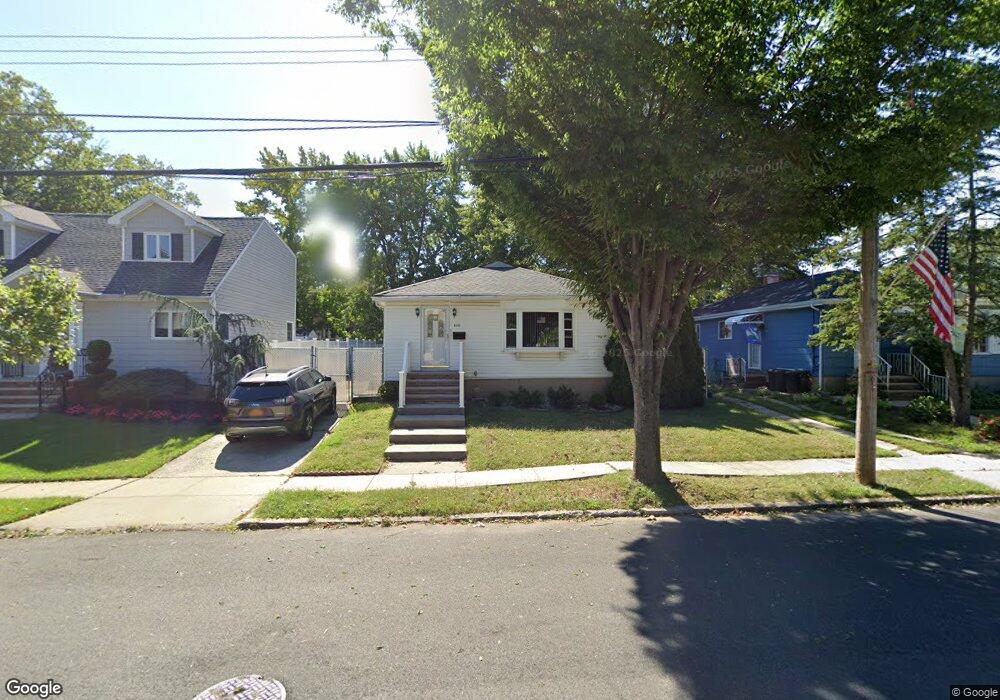
328 Thornycroft Ave Staten Island, NY 10312
Eltingville NeighborhoodEstimated Value: $713,000 - $852,000
3
Beds
2
Baths
1,170
Sq Ft
$677/Sq Ft
Est. Value
About This Home
This home is located at 328 Thornycroft Ave, Staten Island, NY 10312 and is currently estimated at $792,250, approximately $677 per square foot. 328 Thornycroft Ave is a home located in Richmond County with nearby schools including P.S. 55 The Henry M. Boehm School, I.S. 007 Elias Bernstein, and Tottenville High School.
Ownership History
Date
Name
Owned For
Owner Type
Purchase Details
Closed on
May 17, 2007
Sold by
Froewiss Rose A and Froewiss Anthony V
Bought by
Froewiss Rose A and Froewiss Anthony V
Current Estimated Value
Purchase Details
Closed on
Jun 5, 2003
Sold by
Reale Ryan Dennis and Reale Ryan Denise
Bought by
Froewiss Anthony V and Froewiss Rose A
Home Financials for this Owner
Home Financials are based on the most recent Mortgage that was taken out on this home.
Original Mortgage
$75,000
Interest Rate
5.69%
Mortgage Type
Purchase Money Mortgage
Purchase Details
Closed on
Nov 1, 2000
Sold by
Ryan Dennis
Bought by
Reale Ryan Dennis and Reale Ryan Denise
Purchase Details
Closed on
Sep 15, 1997
Sold by
Sensale Robert and Sensale Joan
Bought by
Ryan Dennis
Home Financials for this Owner
Home Financials are based on the most recent Mortgage that was taken out on this home.
Original Mortgage
$152,000
Interest Rate
7.47%
Create a Home Valuation Report for This Property
The Home Valuation Report is an in-depth analysis detailing your home's value as well as a comparison with similar homes in the area
Home Values in the Area
Average Home Value in this Area
Purchase History
| Date | Buyer | Sale Price | Title Company |
|---|---|---|---|
| Froewiss Rose A | -- | None Available | |
| Froewiss Anthony V | $395,000 | The Judicial Title Ins Agenc | |
| Reale Ryan Dennis | -- | Fidelity National Title Ins | |
| Ryan Dennis | $216,000 | Chicago Title Insurance Co |
Source: Public Records
Mortgage History
| Date | Status | Borrower | Loan Amount |
|---|---|---|---|
| Previous Owner | Froewiss Anthony V | $75,000 | |
| Previous Owner | Ryan Dennis | $152,000 |
Source: Public Records
Tax History Compared to Growth
Tax History
| Year | Tax Paid | Tax Assessment Tax Assessment Total Assessment is a certain percentage of the fair market value that is determined by local assessors to be the total taxable value of land and additions on the property. | Land | Improvement |
|---|---|---|---|---|
| 2025 | $6,819 | $44,640 | $10,778 | $33,862 |
| 2024 | $7,100 | $39,420 | $11,514 | $27,906 |
| 2023 | $6,417 | $33,350 | $10,419 | $22,931 |
| 2022 | $5,725 | $37,680 | $12,840 | $24,840 |
| 2021 | $5,746 | $31,980 | $12,840 | $19,140 |
| 2020 | $5,704 | $34,980 | $12,840 | $22,140 |
| 2019 | $5,267 | $37,980 | $12,840 | $25,140 |
| 2018 | $4,781 | $27,792 | $9,608 | $18,184 |
| 2017 | $4,736 | $26,352 | $12,476 | $13,876 |
| 2016 | $4,624 | $26,352 | $11,724 | $14,628 |
| 2015 | $4,114 | $26,021 | $10,113 | $15,908 |
| 2014 | $4,114 | $24,549 | $10,162 | $14,387 |
Source: Public Records
Map
Nearby Homes
- 331 Winchester Ave
- 323 Winchester Ave
- 249 Ridgecrest Ave
- 22 Crest Loop
- 4087 Richmond Ave
- 247 Hillcrest St
- 127 Ridgecrest Ave
- 232 Robinson Ave
- 125 Ridgecrest Ave
- 97 Lyndale Ave
- 0 Oakdale St
- 445 Beach Rd
- 190 Oakdale St
- 233 King St
- 107 Elmwood Ave
- 474 Armstrong Ave
- 475 Beach Rd
- 485 Armstrong Ave Unit D - 3
- 485 Armstrong Ave Unit D2
- 485 Armstrong Ave Unit E1
- 324 Thornycroft Ave
- 334 Thornycroft Ave
- 339 Winchester Ave
- 335 Winchester Ave
- 343 Winchester Ave
- 340 Thornycroft Ave
- 347 Winchester Ave
- 314 Thornycroft Ave
- 329 Thornycroft Ave
- 327 Winchester Ave
- 335 Thornycroft Ave
- 325 Thornycroft Ave
- 351 Winchester Ave
- 346 Thornycroft Ave
- 339 Thornycroft Ave
- 321 Thornycroft Ave
- 355 Winchester Ave Unit 2ND LEVEL
- 355 Winchester Ave
- 319 Winchester Ave
- 343 Thornycroft Ave