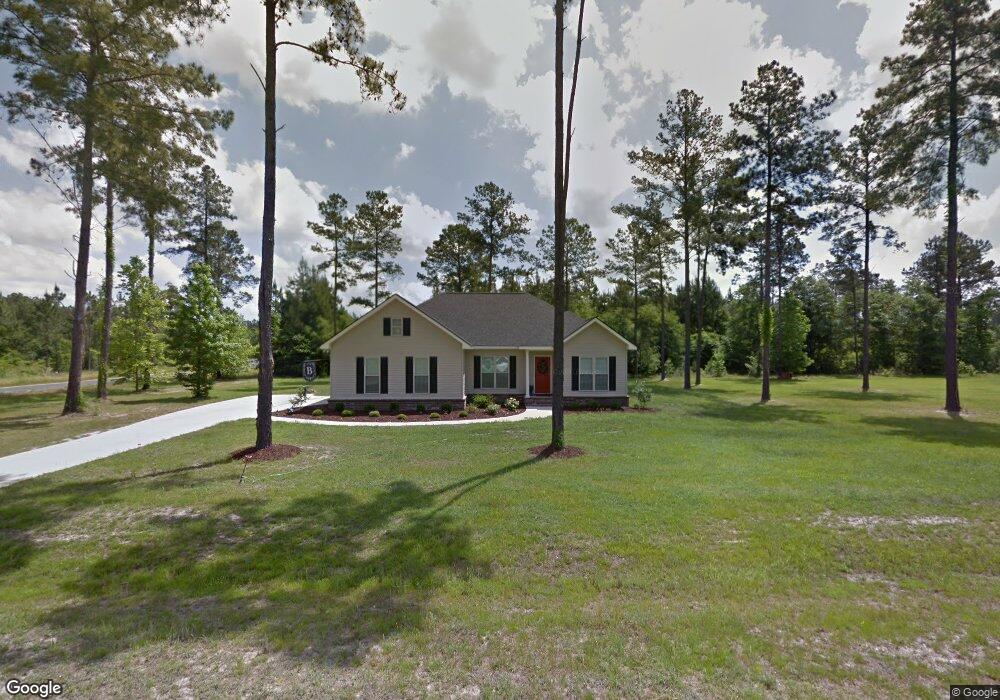
328 Treasure Blvd Brooklet, GA 30415
Estimated Value: $273,969 - $334,000
3
Beds
2
Baths
1,455
Sq Ft
$207/Sq Ft
Est. Value
About This Home
This home is located at 328 Treasure Blvd, Brooklet, GA 30415 and is currently estimated at $301,742, approximately $207 per square foot. 328 Treasure Blvd is a home located in Bulloch County with nearby schools including Brooklet Elementary School, Southeast Bulloch High School, and Southeast Bulloch Middle School.
Ownership History
Date
Name
Owned For
Owner Type
Purchase Details
Closed on
Aug 15, 2014
Sold by
Bennett Morgan A
Bought by
Davis David O
Current Estimated Value
Home Financials for this Owner
Home Financials are based on the most recent Mortgage that was taken out on this home.
Original Mortgage
$141,477
Outstanding Balance
$107,295
Interest Rate
4.2%
Mortgage Type
VA
Estimated Equity
$194,447
Purchase Details
Closed on
Oct 12, 2012
Sold by
Nesmith Construction Inc
Bought by
Bennett Morgan A
Home Financials for this Owner
Home Financials are based on the most recent Mortgage that was taken out on this home.
Original Mortgage
$139,795
Interest Rate
3.6%
Mortgage Type
New Conventional
Purchase Details
Closed on
Jan 17, 2012
Sold by
First Southern National Bank
Bought by
Heritage Bank Of The South
Purchase Details
Closed on
Jul 7, 2009
Bought by
First Southern National Bank
Purchase Details
Closed on
Jan 23, 2006
Sold by
Not Provided
Bought by
First Southern National Bank
Create a Home Valuation Report for This Property
The Home Valuation Report is an in-depth analysis detailing your home's value as well as a comparison with similar homes in the area
Purchase History
| Date | Buyer | Sale Price | Title Company |
|---|---|---|---|
| Davis David O | $138,500 | -- | |
| Bennett Morgan A | $137,000 | -- | |
| Heritage Bank Of The South | -- | -- | |
| First Southern National Bank | -- | -- | |
| First Southern National Bank | -- | -- |
Source: Public Records
Mortgage History
| Date | Status | Borrower | Loan Amount |
|---|---|---|---|
| Open | Davis David O | $141,477 | |
| Previous Owner | Bennett Morgan A | $139,795 |
Source: Public Records
Tax History
| Year | Tax Paid | Tax Assessment Tax Assessment Total Assessment is a certain percentage of the fair market value that is determined by local assessors to be the total taxable value of land and additions on the property. | Land | Improvement |
|---|---|---|---|---|
| 2025 | $3,028 | $103,160 | $20,000 | $83,160 |
| 2024 | $2,739 | $96,720 | $20,000 | $76,720 |
| 2023 | $2,615 | $83,880 | $14,000 | $69,880 |
| 2022 | $1,477 | $68,451 | $8,000 | $60,451 |
| 2021 | $1,373 | $62,018 | $8,000 | $54,018 |
| 2020 | $1,341 | $59,001 | $8,000 | $51,001 |
| 2019 | $1,330 | $58,234 | $7,200 | $51,034 |
| 2018 | $1,298 | $57,214 | $7,200 | $50,014 |
| 2017 | $1,267 | $55,108 | $7,200 | $47,908 |
| 2016 | $1,251 | $53,002 | $7,200 | $45,802 |
| 2015 | $1,265 | $53,421 | $5,200 | $48,221 |
| 2014 | $1,166 | $53,421 | $5,200 | $48,221 |
Source: Public Records
Map
Nearby Homes
- 305 Treasure Blvd
- 643 Buie Rd
- 209 Elm St
- 206 E Lane St
- 0 Highway 80 E Unit 10712661
- 210 Parker Ave N
- 207 Dixie St
- 10143 U S 80
- 111 Old Auburn Ln
- 713 W Lane St
- 116 Summer Wind Place
- 1615 Colony Ln
- 0 Old Leefield Rd Unit 10626397
- 893 W Lane St
- 19477 Us Highway 80 E
- 0 E Highway 80 Hwy Unit 10490324
- 1603 Lennox Rd
- 0 Buie Driggers Rd Unit 10639920
- 6302 C T Place
- 3106 Mccall Blvd
- 328 Treasure Blvd Unit 39
- 426 Serenity Ave Unit 38
- 426 Serenity Ave
- 324 Treasure Blvd
- 137 Sugarland Blvd
- 412 Serenity Ave
- 129 Sugarland Blvd
- 421 Serenity Ave Unit 29
- 421 Serenity Ave
- 141 Sugarland Blvd
- 417 Serenity Ave
- 0 Sugarland Unit LOT 4 7288236
- 0 Sugarland Unit LOT56 7327472
- 0 Sugarland Unit 4 7499797
- 0 Sugarland Unit 43 7544685
- 0 Sugarland Unit 44 7544686
- 0 Sugarland Unit Lot 46 8000445
- 0 Sugarland Unit LOT56
- 0 Sugarland Unit LOT 4
- 0 Sugarland Unit 44 7536477
Your Personal Tour Guide
Ask me questions while you tour the home.