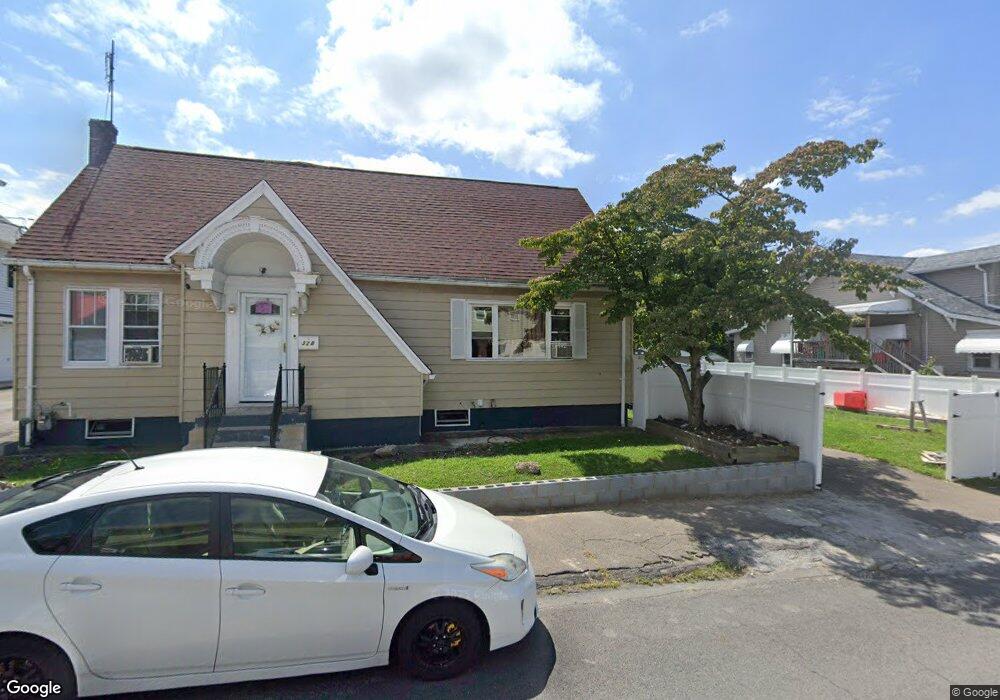
328 W 16th St Hazleton, PA 18201
Estimated Value: $222,000 - $246,000
3
Beds
2
Baths
1,520
Sq Ft
$154/Sq Ft
Est. Value
About This Home
This home is located at 328 W 16th St, Hazleton, PA 18201 and is currently estimated at $233,400, approximately $153 per square foot. 328 W 16th St is a home located in Luzerne County with nearby schools including Hazleton Area High School, Immanuel Christian School, and Holy Family Academy.
Ownership History
Date
Name
Owned For
Owner Type
Purchase Details
Closed on
Feb 18, 2014
Sold by
Mendez Jesus
Bought by
Collado Tirzon Antonio
Current Estimated Value
Purchase Details
Closed on
Mar 8, 2011
Sold by
Ohio Investments Llc
Bought by
Mendez Jesus
Purchase Details
Closed on
Dec 15, 2010
Sold by
Secretary Of Housing & Urban Development
Bought by
Ohio Investments Llc and Balzer Business & Land Investments Llc
Purchase Details
Closed on
May 3, 2010
Sold by
Bac Home Loans Servicing Lp
Bought by
The Secretary Of Housing & Urban Develop
Purchase Details
Closed on
Mar 25, 2010
Sold by
Delos Santos Amaury and De Los Santos Balbina
Bought by
Bac Home Loans Servicing Lp and Countrywide Home Loans Servicing Lp
Purchase Details
Closed on
Apr 14, 2006
Sold by
Rodriguez Fatima
Bought by
Los Santos Amaury De and Los Santos Balbina De
Create a Home Valuation Report for This Property
The Home Valuation Report is an in-depth analysis detailing your home's value as well as a comparison with similar homes in the area
Home Values in the Area
Average Home Value in this Area
Purchase History
| Date | Buyer | Sale Price | Title Company |
|---|---|---|---|
| Collado Tirzon Antonio | $20,000 | None Available | |
| Mendez Jesus | $25,000 | None Available | |
| Ohio Investments Llc | $10,238 | None Available | |
| The Secretary Of Housing & Urban Develop | -- | None Available | |
| Bac Home Loans Servicing Lp | $1,593 | None Available | |
| Los Santos Amaury De | $116,000 | None Available |
Source: Public Records
Tax History Compared to Growth
Tax History
| Year | Tax Paid | Tax Assessment Tax Assessment Total Assessment is a certain percentage of the fair market value that is determined by local assessors to be the total taxable value of land and additions on the property. | Land | Improvement |
|---|---|---|---|---|
| 2025 | $3,909 | $136,100 | $24,200 | $111,900 |
| 2024 | $3,663 | $136,100 | $24,200 | $111,900 |
| 2023 | $3,424 | $136,100 | $24,200 | $111,900 |
| 2022 | $3,399 | $136,100 | $24,200 | $111,900 |
| 2021 | $3,320 | $136,100 | $24,200 | $111,900 |
| 2020 | $2,967 | $136,100 | $24,200 | $111,900 |
| 2019 | $3,061 | $136,100 | $24,200 | $111,900 |
| 2018 | $2,957 | $136,100 | $24,200 | $111,900 |
| 2017 | $2,726 | $136,100 | $24,200 | $111,900 |
| 2016 | $1,553 | $136,100 | $24,200 | $111,900 |
| 2015 | -- | $136,100 | $24,200 | $111,900 |
| 2014 | -- | $136,100 | $24,200 | $111,900 |
Source: Public Records
Map
Nearby Homes
- 827 N Vine St
- 739 N Church St
- 837 N Laurel St
- 882 N Locust St
- 714 Alter St
- 19 W 14th St
- 738 N Manhattan Ct
- 782 N James St
- 756 Peace St
- 756 Seybert St
- 1009 Peace St
- 572 N Vine St
- 14 W 5th St
- 991 Seybert St
- 530 N Lee Ct
- 1087 N Rear Locust St
- 523 N Laurel St
- 127 W Diamond Ave
- 522 N James St
- 538 Carson St Unit 40