Estimated Value: $351,000 - $385,000
3
Beds
1
Bath
1,284
Sq Ft
$285/Sq Ft
Est. Value
About This Home
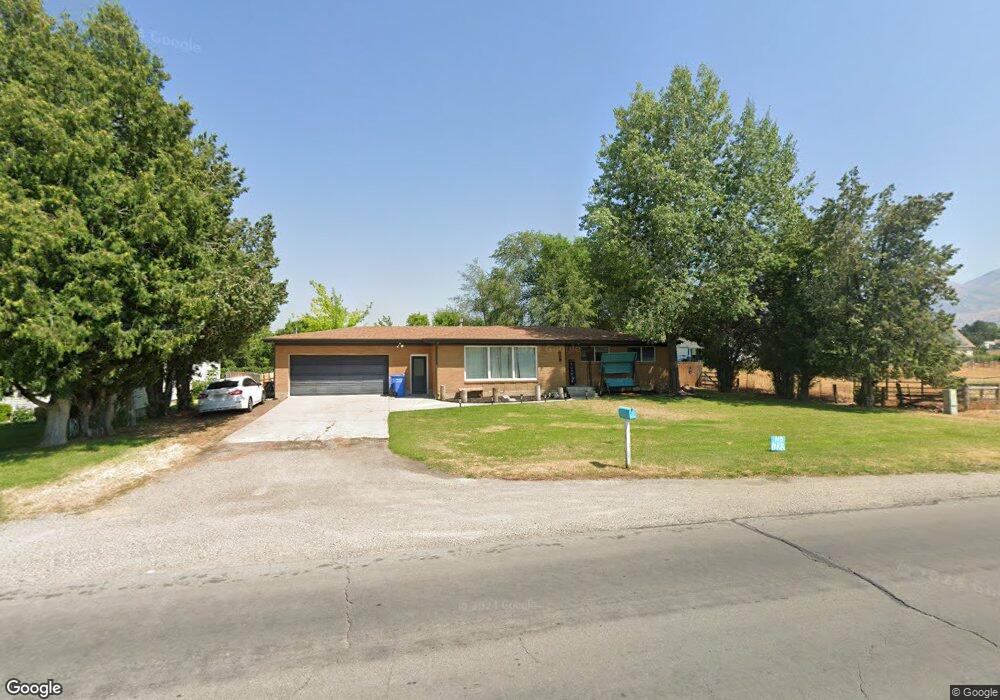
This home is located at 328 W 300 S, Hyrum, UT 84319 and is currently estimated at $365,510, approximately $284 per square foot. 328 W 300 S is a home located in Cache County with nearby schools including Lincoln School, South Cache Middle School, and Mountain Crest High School.
Ownership History
Date
Name
Owned For
Owner Type
Purchase Details
Closed on
Sep 16, 2019
Sold by
Lambert Morgan and Lambert Morgan
Bought by
Petersen Glen E and Petersen Tracie R
Current Estimated Value
Purchase Details
Closed on
Sep 1, 2016
Sold by
Freston Shawna Kay
Bought by
Freston Brendon and Lambert Morgan
Home Financials for this Owner
Home Financials are based on the most recent Mortgage that was taken out on this home.
Original Mortgage
$123,200
Interest Rate
3.43%
Mortgage Type
New Conventional
Purchase Details
Closed on
Jul 28, 2005
Sold by
Nielsen Darin Layne and Nielsen Shelli Gibbons
Bought by
Freston Trevor R and Freston Shawna Kay
Home Financials for this Owner
Home Financials are based on the most recent Mortgage that was taken out on this home.
Original Mortgage
$102,000
Interest Rate
5.56%
Mortgage Type
New Conventional
Create a Home Valuation Report for This Property
The Home Valuation Report is an in-depth analysis detailing your home's value as well as a comparison with similar homes in the area
Home Values in the Area
Average Home Value in this Area
Purchase History
| Date | Buyer | Sale Price | Title Company |
|---|---|---|---|
| Petersen Glen E | -- | American Secure Title Logan | |
| Freston Brendon | -- | Hickman Land Title Co | |
| Freston Trevor R | -- | American Secure Title |
Source: Public Records
Mortgage History
| Date | Status | Borrower | Loan Amount |
|---|---|---|---|
| Previous Owner | Freston Brendon | $123,200 | |
| Previous Owner | Freston Trevor R | $102,000 |
Source: Public Records
Tax History Compared to Growth
Tax History
| Year | Tax Paid | Tax Assessment Tax Assessment Total Assessment is a certain percentage of the fair market value that is determined by local assessors to be the total taxable value of land and additions on the property. | Land | Improvement |
|---|---|---|---|---|
| 2024 | $1,407 | $188,680 | $0 | $0 |
| 2023 | $1,419 | $181,935 | $0 | $0 |
| 2022 | $1,481 | $181,940 | $0 | $0 |
| 2021 | $1,386 | $262,310 | $66,660 | $195,650 |
| 2020 | $1,223 | $217,160 | $66,660 | $150,500 |
| 2019 | $1,169 | $195,300 | $44,800 | $150,500 |
| 2018 | $820 | $132,496 | $44,800 | $87,696 |
| 2017 | $808 | $67,705 | $0 | $0 |
| 2016 | $826 | $67,705 | $0 | $0 |
| 2015 | $828 | $67,705 | $0 | $0 |
| 2014 | $828 | $69,265 | $0 | $0 |
| 2013 | -- | $66,850 | $0 | $0 |
Source: Public Records
Map
Nearby Homes