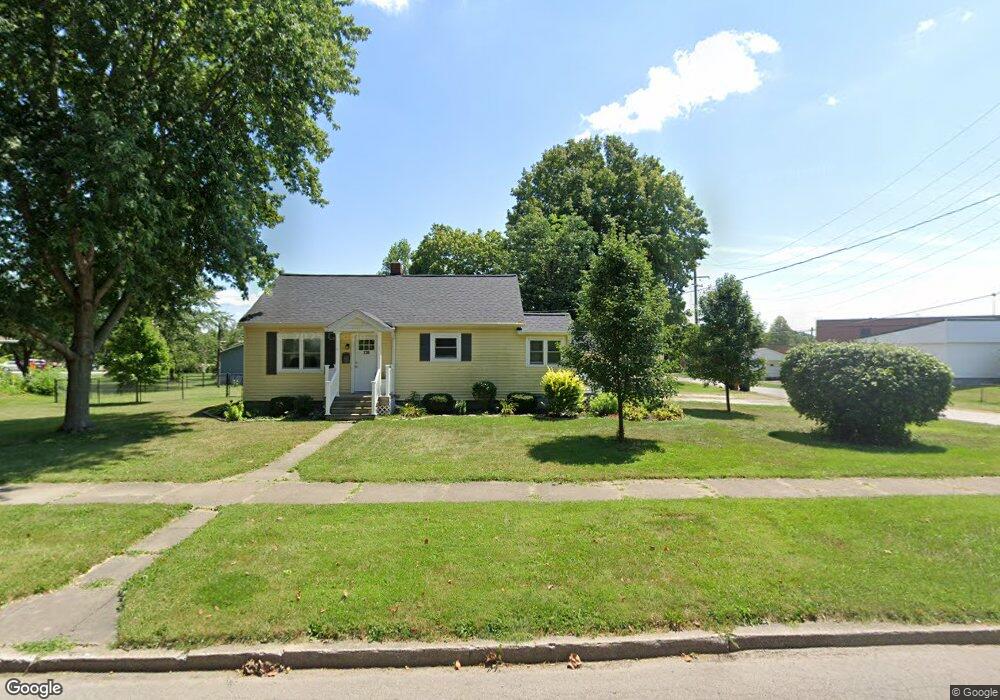
328 W Summit St Delphi, IN 46923
Estimated Value: $124,000 - $153,000
2
Beds
2
Baths
768
Sq Ft
$184/Sq Ft
Est. Value
About This Home
This home is located at 328 W Summit St, Delphi, IN 46923 and is currently estimated at $141,461, approximately $184 per square foot. 328 W Summit St is a home located in Carroll County with nearby schools including Delphi Community Elementary School, Delphi Community Middle School, and Delphi Community High School.
Ownership History
Date
Name
Owned For
Owner Type
Purchase Details
Closed on
Dec 18, 2020
Sold by
Everett Allison
Bought by
Allbaugh Erica J
Current Estimated Value
Home Financials for this Owner
Home Financials are based on the most recent Mortgage that was taken out on this home.
Original Mortgage
$76,587
Outstanding Balance
$67,713
Interest Rate
2.7%
Mortgage Type
FHA
Estimated Equity
$73,748
Purchase Details
Closed on
Jan 25, 2018
Sold by
Farrell Allison and Farrell Gary
Bought by
Everett Allison
Purchase Details
Closed on
Mar 26, 2013
Sold by
Farrell Allison J and Cocanower Allison J
Bought by
Farrell Gary K and Farrell Allison J
Home Financials for this Owner
Home Financials are based on the most recent Mortgage that was taken out on this home.
Original Mortgage
$54,850
Interest Rate
3.52%
Mortgage Type
New Conventional
Purchase Details
Closed on
Sep 29, 1997
Sold by
Ganlund Richard and Ganlund Candi
Bought by
Cocanower Allison
Create a Home Valuation Report for This Property
The Home Valuation Report is an in-depth analysis detailing your home's value as well as a comparison with similar homes in the area
Home Values in the Area
Average Home Value in this Area
Purchase History
| Date | Buyer | Sale Price | Title Company |
|---|---|---|---|
| Allbaugh Erica J | -- | None Available | |
| Everett Allison | -- | None Available | |
| Farrell Gary K | -- | Servicelink | |
| Cocanower Allison | $57,000 | -- |
Source: Public Records
Mortgage History
| Date | Status | Borrower | Loan Amount |
|---|---|---|---|
| Open | Allbaugh Erica J | $76,587 | |
| Previous Owner | Farrell Gary K | $54,850 |
Source: Public Records
Tax History
| Year | Tax Paid | Tax Assessment Tax Assessment Total Assessment is a certain percentage of the fair market value that is determined by local assessors to be the total taxable value of land and additions on the property. | Land | Improvement |
|---|---|---|---|---|
| 2025 | $734 | $107,400 | $28,500 | $78,900 |
| 2024 | $734 | $97,200 | $28,500 | $68,700 |
| 2023 | $505 | $87,200 | $28,500 | $58,700 |
| 2022 | $505 | $78,800 | $25,900 | $52,900 |
| 2021 | $446 | $70,000 | $23,700 | $46,300 |
| 2020 | $446 | $68,000 | $23,700 | $44,300 |
| 2019 | $429 | $64,200 | $23,700 | $40,500 |
| 2018 | $419 | $62,300 | $23,700 | $38,600 |
| 2017 | $1,251 | $62,300 | $21,300 | $41,000 |
| 2016 | $1,262 | $63,100 | $21,300 | $41,800 |
| 2014 | $1,246 | $62,300 | $21,300 | $41,000 |
Source: Public Records
Map
Nearby Homes
- 232 W Vine St
- 230 W Vine St
- 228 W Vine St
- 424 W Summit St
- 116 W North St
- 409 Heritage Dr
- 116 Williston Ct
- 112 Williston Ct
- 201 E Franklin St
- 409 E Franklin St
- 519 E Franklin St
- 317 N Market St
- 109 N Lafayette St
- 610 N Wilson St
- 1158 N Deer Meadows Rd
- 2660 N Dreifers Ave
- 2801 N 930 W Unit 10
- 9331 W 310 N
- 35 Pond View Dr
- 10379 W 400 N
- 909 S Illinois St
- 318 W Summit St
- 404 W Summit St
- 339 W Summit St
- 408 W Summit St
- 309 W Summit St
- 307 W Summit St
- 411 W Summit St
- 304 W Summit St
- 414 W Summit St
- 305 W Summit St
- 807 S Hamilton St
- 815 S Hamilton St
- 322 W North St
- 328 W North St
- 234 W Summit St
- 314 W N
- 314 W North St
- 233 W Summit St
- 233 W Vine St
Your Personal Tour Guide
Ask me questions while you tour the home.