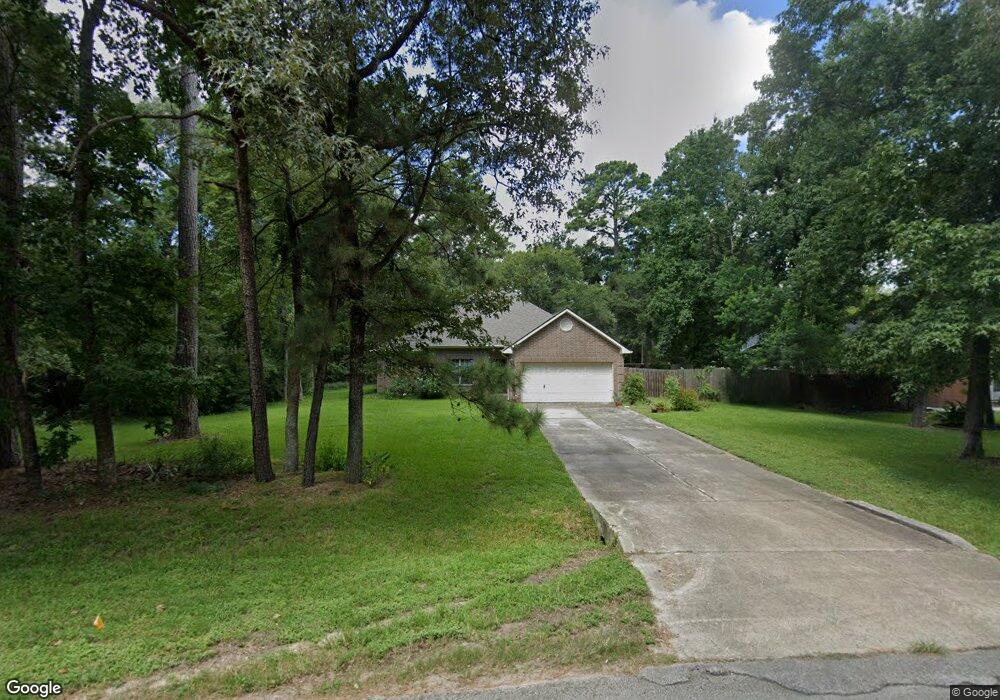
32803 Oak Creek Dr Magnolia, TX 77354
Westwood NeighborhoodEstimated Value: $338,000 - $382,000
3
Beds
2
Baths
1,642
Sq Ft
$216/Sq Ft
Est. Value
About This Home
This home is located at 32803 Oak Creek Dr, Magnolia, TX 77354 and is currently estimated at $354,735, approximately $216 per square foot. 32803 Oak Creek Dr is a home located in Montgomery County with nearby schools including Bear Branch Elementary School, Bear Branch Junior High School, and Magnolia High School.
Ownership History
Date
Name
Owned For
Owner Type
Purchase Details
Closed on
Aug 30, 2016
Sold by
Kallenberg Richard A
Bought by
Mullins Mark
Current Estimated Value
Home Financials for this Owner
Home Financials are based on the most recent Mortgage that was taken out on this home.
Original Mortgage
$165,000
Outstanding Balance
$131,880
Interest Rate
3.45%
Mortgage Type
New Conventional
Estimated Equity
$222,855
Purchase Details
Closed on
Dec 19, 2003
Sold by
Supreme Builders Ltd
Bought by
Kallenberg Richard A
Home Financials for this Owner
Home Financials are based on the most recent Mortgage that was taken out on this home.
Original Mortgage
$132,070
Interest Rate
6.02%
Mortgage Type
VA
Purchase Details
Closed on
Aug 7, 2003
Sold by
Renner Susan Benton
Bought by
Mullins Mark and Mullins Barbara
Create a Home Valuation Report for This Property
The Home Valuation Report is an in-depth analysis detailing your home's value as well as a comparison with similar homes in the area
Home Values in the Area
Average Home Value in this Area
Purchase History
| Date | Buyer | Sale Price | Title Company |
|---|---|---|---|
| Mullins Mark | -- | None Available | |
| Kallenberg Richard A | -- | Fidelity National Title | |
| Mullins Mark | -- | -- |
Source: Public Records
Mortgage History
| Date | Status | Borrower | Loan Amount |
|---|---|---|---|
| Open | Mullins Mark | $165,000 | |
| Previous Owner | Kallenberg Richard A | $132,070 |
Source: Public Records
Tax History Compared to Growth
Tax History
| Year | Tax Paid | Tax Assessment Tax Assessment Total Assessment is a certain percentage of the fair market value that is determined by local assessors to be the total taxable value of land and additions on the property. | Land | Improvement |
|---|---|---|---|---|
| 2025 | $1,863 | $315,000 | $82,720 | $232,280 |
| 2024 | $1,836 | $310,970 | -- | -- |
| 2023 | $1,836 | $282,700 | $82,720 | $248,510 |
| 2022 | $4,535 | $257,000 | $68,920 | $231,810 |
| 2021 | $4,343 | $233,640 | $58,900 | $174,740 |
| 2020 | $4,502 | $222,450 | $58,900 | $163,550 |
| 2019 | $4,420 | $219,490 | $58,900 | $161,200 |
| 2018 | $3,211 | $199,540 | $23,150 | $176,390 |
| 2017 | $4,231 | $199,540 | $23,150 | $176,390 |
| 2016 | $4,068 | $191,820 | $23,150 | $168,670 |
| 2015 | $2,630 | $177,160 | $23,150 | $154,010 |
| 2014 | $2,630 | $164,610 | $23,150 | $141,460 |
Source: Public Records
Map
Nearby Homes
- 32726 Riverwood Dr
- 33003 Westwood Square East Dr
- 7115 Nickaburr Creek Dr
- 139 Velvet Grass Ct
- 7215 Ramblewood Dr
- 14 N Flickering Sun Cir
- 42555 Rustico Rd
- 15 Forest Perch Place
- 135 S Bluff Creek Cir
- 7203 Ponderosa Dr
- 51 S Crisp Morning Cir
- 7407 Ramblewood Dr
- 7407 Nickaburr Creek Dr
- 7402 Nickaburr Creek Dr
- 7415 Charred Pine Dr
- 7507 Charred Pine Dr
- 319 Weisinger Dr
- 90 S Goldenvine Cir
- 33127 Cottonwood Bend
- 143 S Goldenvine Cir
- 12660 Luger Ln
- 12664 Luger Ln
- 32807 Oak Creek Dr
- 32714 Westwood Square Dr W
- 32802 Westwood Square West Dr
- 32802 Westwood Square Dr W
- 32714 Westwood Square West Dr
- 32714 Westwood Square West Dr
- 32811 Oak Creek Dr
- 32806 Westwood Square Dr W
- 32802 Oak Creek Dr
- 32806 Westwood Square West Dr
- 0 Oak Crest Unit 64352090
- 0 Oak Creek Dr
- 32815 Oak Creek Dr
- 32810 Westwood Square West Dr
- 32810 Westwood Square Dr E
- 32810 Westwood Square West Dr
- 32715 Westwood Square East Dr
- 32814 Oak Creek Dr