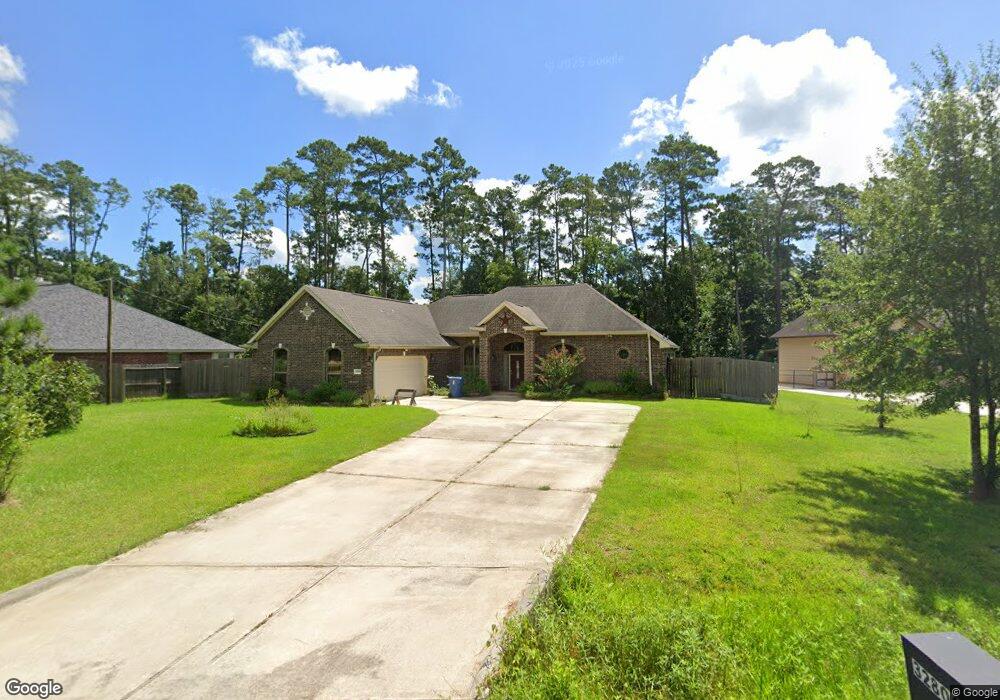
32806 Riverwood Dr Magnolia, TX 77354
Westwood NeighborhoodEstimated Value: $464,000 - $502,000
3
Beds
3
Baths
2,444
Sq Ft
$197/Sq Ft
Est. Value
About This Home
This home is located at 32806 Riverwood Dr, Magnolia, TX 77354 and is currently estimated at $480,278, approximately $196 per square foot. 32806 Riverwood Dr is a home located in Montgomery County with nearby schools including Bear Branch Elementary School, Bear Branch Junior High School, and Magnolia High School.
Ownership History
Date
Name
Owned For
Owner Type
Purchase Details
Closed on
Jan 30, 2015
Sold by
Lacey Theresa Renee
Bought by
Pickett Thomas C and Pickett Nia K
Current Estimated Value
Home Financials for this Owner
Home Financials are based on the most recent Mortgage that was taken out on this home.
Original Mortgage
$220,500
Outstanding Balance
$75,772
Interest Rate
3.83%
Mortgage Type
New Conventional
Estimated Equity
$404,506
Purchase Details
Closed on
Jul 26, 2012
Sold by
Ballater Ltd
Bought by
Lacey Theresa Renee
Home Financials for this Owner
Home Financials are based on the most recent Mortgage that was taken out on this home.
Original Mortgage
$192,720
Interest Rate
3.72%
Mortgage Type
New Conventional
Purchase Details
Closed on
Apr 15, 2003
Sold by
Viehweg Wayne R M and Viehweg D
Bought by
Pickett Thomas C and Pickett Nia K
Create a Home Valuation Report for This Property
The Home Valuation Report is an in-depth analysis detailing your home's value as well as a comparison with similar homes in the area
Home Values in the Area
Average Home Value in this Area
Purchase History
| Date | Buyer | Sale Price | Title Company |
|---|---|---|---|
| Pickett Thomas C | -- | First American Title | |
| Lacey Theresa Renee | -- | Stewart Title Of Montgomery | |
| Pickett Thomas C | -- | -- | |
| Pickett Thomas C | -- | -- |
Source: Public Records
Mortgage History
| Date | Status | Borrower | Loan Amount |
|---|---|---|---|
| Open | Pickett Thomas C | $220,500 | |
| Previous Owner | Pickett Thomas C | $192,720 |
Source: Public Records
Tax History Compared to Growth
Tax History
| Year | Tax Paid | Tax Assessment Tax Assessment Total Assessment is a certain percentage of the fair market value that is determined by local assessors to be the total taxable value of land and additions on the property. | Land | Improvement |
|---|---|---|---|---|
| 2025 | $3,630 | $489,675 | -- | -- |
| 2024 | $3,594 | $445,159 | -- | -- |
| 2023 | $3,594 | $404,690 | $82,600 | $394,750 |
| 2022 | $6,492 | $367,900 | $68,820 | $368,210 |
| 2021 | $6,216 | $334,450 | $58,820 | $275,630 |
| 2020 | $6,520 | $322,190 | $58,820 | $263,370 |
| 2019 | $6,268 | $311,250 | $58,820 | $252,430 |
| 2018 | $6,327 | $299,320 | $23,120 | $276,200 |
| 2017 | $6,347 | $299,320 | $23,120 | $276,200 |
| 2016 | $6,467 | $304,960 | $23,120 | $281,840 |
| 2015 | $5,122 | $269,350 | $16,870 | $252,480 |
| 2014 | $5,122 | $248,780 | $16,870 | $231,910 |
Source: Public Records
Map
Nearby Homes
- 32726 Riverwood Dr
- 7115 Nickaburr Creek Dr
- 7215 Ramblewood Dr
- 33003 Westwood Square East Dr
- 42555 Rustico Rd
- 7407 Ramblewood Dr
- 7407 Nickaburr Creek Dr
- 7402 Nickaburr Creek Dr
- 7415 Charred Pine Dr
- 139 Velvet Grass Ct
- 7203 Ponderosa Dr
- 7507 Charred Pine Dr
- 14 N Flickering Sun Cir
- 15 Forest Perch Place
- 33127 Cottonwood Bend
- 0 Magnolia Cir
- 7215 Autumn Day Ct
- 51 S Crisp Morning Cir
- 135 S Bluff Creek Cir
- 286 Brazen Forest Trail
- 32802 Riverwood Dr
- 32810 Riverwood Dr
- 32815 Westwood Square West Dr
- 32815 Westwood Square Dr W
- 32814 Riverwood Dr
- 32811 Westwood Square West Dr
- 7003 Ramblewood Dr
- 32819 Westwood Square Dr W
- 32823 Westwood Square Dr W
- 32722 Riverwood Dr
- 32818 Riverwood Dr
- 7006 Oak Bluff Dr
- 32823 Westwood Square West Dr
- 7002 Ramblewood Dr
- 32803 Westwood Square W
- 32718 Riverwood Dr
- 32903 Westwood Square West Dr
- 32902 Riverwood Dr
- 7010 Oak Bluff Dr
- 32903 Westwood Square West Dr