Estimated Value: $207,771 - $244,000
3
Beds
1
Bath
1,170
Sq Ft
$194/Sq Ft
Est. Value
About This Home
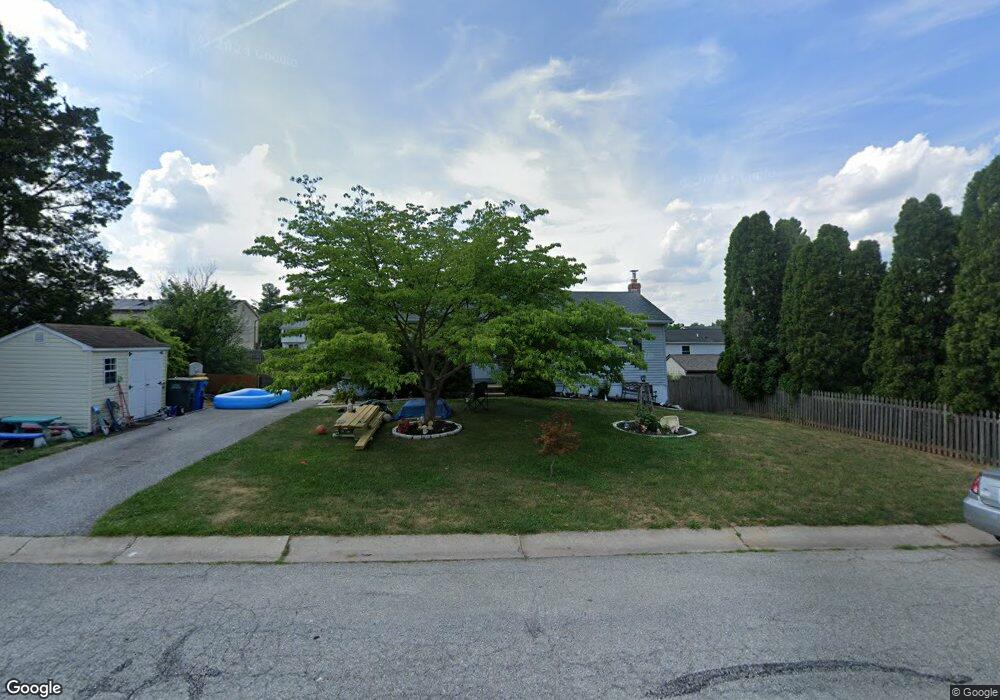
This home is located at 3281 E Pheasant Dr, Dover, PA 17315 and is currently estimated at $226,693, approximately $193 per square foot. 3281 E Pheasant Dr is a home located in York County with nearby schools including Dover Area High School, York Adventist Christian School, and St Rose Of Lima School.
Ownership History
Date
Name
Owned For
Owner Type
Purchase Details
Closed on
Jun 30, 2010
Sold by
Knudson Brian
Bought by
Brown Michael L and Brown Elizabeth E
Current Estimated Value
Home Financials for this Owner
Home Financials are based on the most recent Mortgage that was taken out on this home.
Original Mortgage
$129,259
Outstanding Balance
$88,851
Interest Rate
5.5%
Mortgage Type
FHA
Estimated Equity
$137,842
Purchase Details
Closed on
Jun 30, 2006
Sold by
Creasy Franklin D and Creasy Sheila E
Bought by
Knudson Brian
Home Financials for this Owner
Home Financials are based on the most recent Mortgage that was taken out on this home.
Original Mortgage
$119,059
Interest Rate
6.58%
Mortgage Type
FHA
Purchase Details
Closed on
Jan 26, 2005
Sold by
Lewis Debora A
Bought by
Creasy Franklin D and Creasy Sheila E
Home Financials for this Owner
Home Financials are based on the most recent Mortgage that was taken out on this home.
Original Mortgage
$103,184
Interest Rate
5.67%
Mortgage Type
FHA
Create a Home Valuation Report for This Property
The Home Valuation Report is an in-depth analysis detailing your home's value as well as a comparison with similar homes in the area
Home Values in the Area
Average Home Value in this Area
Purchase History
| Date | Buyer | Sale Price | Title Company |
|---|---|---|---|
| Brown Michael L | $131,000 | None Available | |
| Knudson Brian | $120,000 | None Available | |
| Creasy Franklin D | $104,000 | -- |
Source: Public Records
Mortgage History
| Date | Status | Borrower | Loan Amount |
|---|---|---|---|
| Open | Brown Michael L | $129,259 | |
| Previous Owner | Knudson Brian | $119,059 | |
| Previous Owner | Creasy Franklin D | $103,184 |
Source: Public Records
Tax History
| Year | Tax Paid | Tax Assessment Tax Assessment Total Assessment is a certain percentage of the fair market value that is determined by local assessors to be the total taxable value of land and additions on the property. | Land | Improvement |
|---|---|---|---|---|
| 2025 | $2,943 | $89,710 | $24,750 | $64,960 |
| 2024 | $2,916 | $89,710 | $24,750 | $64,960 |
| 2023 | $2,916 | $89,710 | $24,750 | $64,960 |
| 2022 | $2,863 | $89,710 | $24,750 | $64,960 |
| 2021 | $2,701 | $89,710 | $24,750 | $64,960 |
| 2020 | $2,677 | $89,710 | $24,750 | $64,960 |
| 2019 | $2,644 | $89,710 | $24,750 | $64,960 |
| 2018 | $2,578 | $89,710 | $24,750 | $64,960 |
| 2017 | $2,578 | $89,710 | $24,750 | $64,960 |
| 2016 | $0 | $89,710 | $24,750 | $64,960 |
| 2015 | -- | $89,710 | $24,750 | $64,960 |
| 2014 | -- | $89,710 | $24,750 | $64,960 |
Source: Public Records
Map
Nearby Homes
- 3330 E Pheasant Dr
- 3212 Partridge Dr
- 3567 Kortni Dr
- 3610 S Salem Church Rd
- 3104 Galaxy Rd
- 3025 Solar Dr
- 3030 Solar Dr
- 3056 Solar Dr
- 2981 Ruppert Rd
- 21 Willow Tree Ln
- 138 Meadowview Dr
- 56 Dr
- 2818 Oakland Rd
- 3706 Wheatland Dr
- 3703 Wheatland Dr
- 2162 Golden Eagle Dr Unit 125
- 2164 Golden Eagle Dr Unit 124
- 2450 Walnut Bottom Rd Unit 85
- 3720 Davidsburg Rd
- 2636 Sedgewick Ave
- 3275 E Pheasant Dr
- 3287 E Pheasant Dr
- 3280 Night In Gale Dr
- 3274 Night In Gale Dr
- 3286 Night In Gale Dr
- 3269 E Pheasant Dr
- 3293 E Pheasant Dr
- 3229 E Pheasant Cir
- 3270 Night In Gale Dr
- 3290 Night In Gale Dr
- 3278 E Pheasant Dr
- 3286 E Pheasant Cir
- 3571 Ruffed Grouse Dr
- 3281 Night In Gale Dr
- 3263 E Pheasant Dr
- 3299 E Pheasant Dr
- 3288 E Pheasant Cir
- 3275 Night In Gale Dr
- 3290 E Pheasant Cir
Your Personal Tour Guide
Ask me questions while you tour the home.