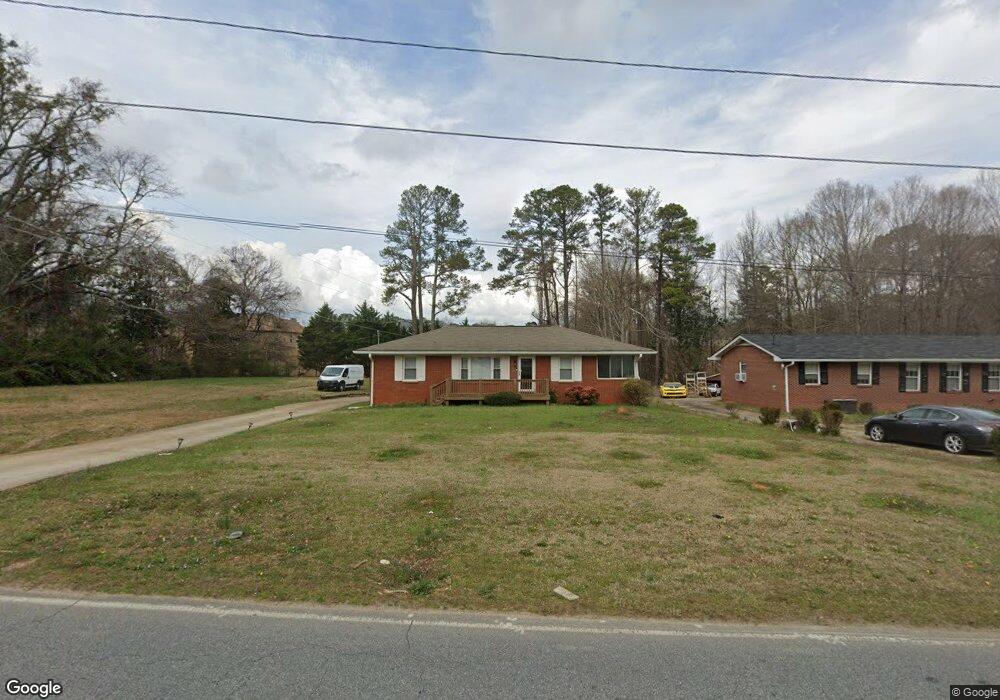
3281 Fairburn Rd SW Unit 7 Atlanta, GA 30331
Ben Hill NeighborhoodEstimated Value: $233,176 - $285,000
4
Beds
2
Baths
2,542
Sq Ft
$106/Sq Ft
Est. Value
About This Home
This home is located at 3281 Fairburn Rd SW Unit 7, Atlanta, GA 30331 and is currently estimated at $269,794, approximately $106 per square foot. 3281 Fairburn Rd SW Unit 7 is a home located in Fulton County with nearby schools including Deerwood Academy School, Bunche Middle School, and Therrell High School.
Ownership History
Date
Name
Owned For
Owner Type
Purchase Details
Closed on
Oct 4, 2021
Sold by
Hightower Alfonsa Lee
Bought by
Turner Chauncey
Current Estimated Value
Home Financials for this Owner
Home Financials are based on the most recent Mortgage that was taken out on this home.
Original Mortgage
$220,924
Outstanding Balance
$201,462
Interest Rate
2.8%
Mortgage Type
FHA
Estimated Equity
$68,332
Purchase Details
Closed on
Nov 18, 2015
Sold by
Hamer Sandra Dials
Bought by
Hightower Alfonsa Lee
Purchase Details
Closed on
Mar 2, 2005
Sold by
Queen Benard
Bought by
Citizens Trust Bk
Purchase Details
Closed on
Nov 3, 1994
Sold by
Nationscredit Financial Corp
Bought by
Queen Bernard
Home Financials for this Owner
Home Financials are based on the most recent Mortgage that was taken out on this home.
Original Mortgage
$46,450
Interest Rate
8.92%
Mortgage Type
FHA
Purchase Details
Closed on
Jun 8, 1994
Sold by
Parks Charles
Bought by
Nationscredit Financial Serv Corp
Create a Home Valuation Report for This Property
The Home Valuation Report is an in-depth analysis detailing your home's value as well as a comparison with similar homes in the area
Home Values in the Area
Average Home Value in this Area
Purchase History
| Date | Buyer | Sale Price | Title Company |
|---|---|---|---|
| Turner Chauncey | $225,000 | -- | |
| Hightower Alfonsa Lee | -- | -- | |
| Citizens Trust Bk | $78,869 | -- | |
| Queen Bernard | $46,500 | -- | |
| Nationscredit Financial Serv Corp | $32,000 | -- |
Source: Public Records
Mortgage History
| Date | Status | Borrower | Loan Amount |
|---|---|---|---|
| Open | Turner Chauncey | $220,924 | |
| Previous Owner | Queen Bernard | $46,450 |
Source: Public Records
Tax History Compared to Growth
Tax History
| Year | Tax Paid | Tax Assessment Tax Assessment Total Assessment is a certain percentage of the fair market value that is determined by local assessors to be the total taxable value of land and additions on the property. | Land | Improvement |
|---|---|---|---|---|
| 2025 | $1,546 | $102,160 | $12,120 | $90,040 |
| 2023 | $4,412 | $106,560 | $18,840 | $87,720 |
| 2022 | $1,266 | $87,960 | $13,120 | $74,840 |
| 2021 | $1,906 | $47,040 | $9,120 | $37,920 |
| 2020 | $1,570 | $38,320 | $6,280 | $32,040 |
| 2019 | $495 | $33,480 | $6,880 | $26,600 |
| 2018 | $1,073 | $25,920 | $4,000 | $21,920 |
| 2017 | $506 | $11,720 | $2,280 | $9,440 |
| 2016 | $507 | $11,720 | $2,280 | $9,440 |
| 2015 | $1,017 | $11,720 | $2,280 | $9,440 |
| 2014 | $531 | $11,720 | $2,280 | $9,440 |
Source: Public Records
Map
Nearby Homes
- 3179 Landings N
- 3282 Victoria Park SW
- 4008 Princeton Lakes Way SW
- 4000 Princeton Lakes Pass SW
- 3699 Ramsey Cir SW
- 2873 Deerwood Dr SW
- 3350 Old Fairburn Rd SW
- 3028 Deerborne Ct SW
- 3153 Daleview Way SW
- 2959 Fairburn Rd SW
- 3083 Dawson Ln SW
- 3730 Stephanie Dr SW
- 3814 N Camp Creek Pkwy SW
- 4001 Riverchess Dr SW
- Britton Plan at Tell River
- Clifton Plan at Tell River
- Wynbrooke 4 Bedroom Plan at Tell River
- 3964 Riverchess Dr SW
- 3812 Kathryn Dr SW
- 3281 Fairburn Rd SW
- 3279 Fairburn Rd SW
- 3297 Fairburn Rd SW
- 3230 Landings North Dr
- 3220 Landings Dr N
- 3220 Landing Dr N
- 3115 Benniger Trace
- 3115 Benninger Trace SW
- 3115 Benninger Trace Sw 0
- 3296 Fairburn Rd SW
- 3116 Benninger Trace SW
- 3210 Landings North Ct
- 3179 Landings North Dr
- 3189 Landings North Dr
- 3199 Landings Dr N
- 3199 Landings North Dr
- 3117 Benninger Trace SW
- 3233 Landings North Ct
- 3210 Landings Dr N
- 3210 Landings North Ct