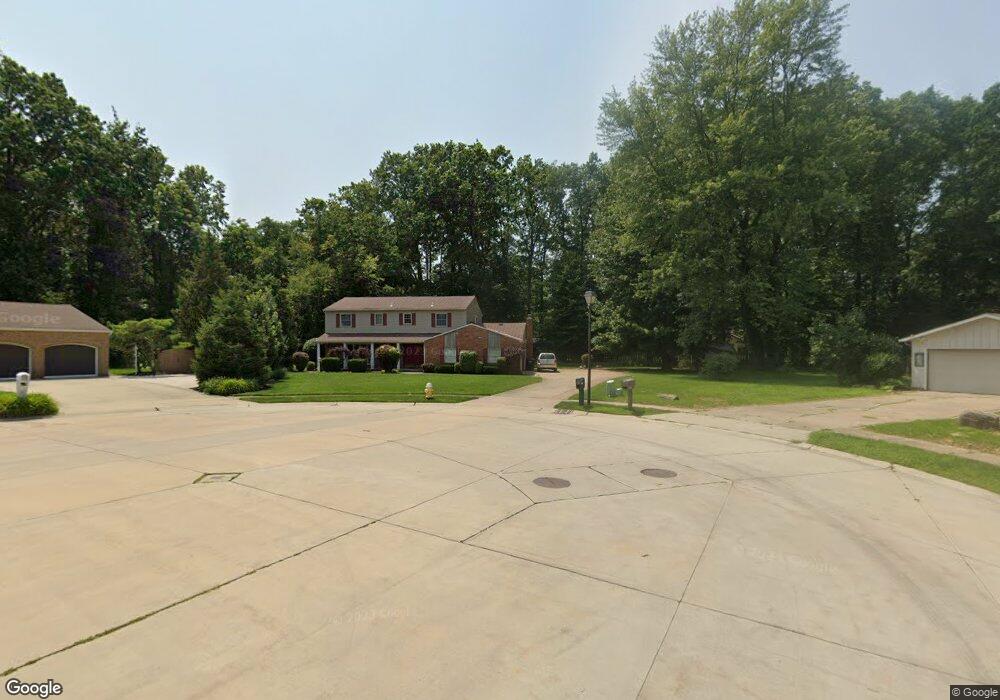
32811 Coventry Ct Avon Lake, OH 44012
Estimated Value: $422,000 - $480,614
4
Beds
3
Baths
2,492
Sq Ft
$180/Sq Ft
Est. Value
About This Home
This home is located at 32811 Coventry Ct, Avon Lake, OH 44012 and is currently estimated at $448,654, approximately $180 per square foot. 32811 Coventry Ct is a home located in Lorain County with nearby schools including Redwood Elementary School, Troy Intermediate Elementary School, and Learwood Middle School.
Ownership History
Date
Name
Owned For
Owner Type
Purchase Details
Closed on
May 17, 2006
Sold by
Hastings Scott A and Hastings Kim M
Bought by
Stefanik Dorothy M
Current Estimated Value
Home Financials for this Owner
Home Financials are based on the most recent Mortgage that was taken out on this home.
Original Mortgage
$141,000
Outstanding Balance
$82,313
Interest Rate
6.54%
Mortgage Type
Fannie Mae Freddie Mac
Estimated Equity
$366,341
Purchase Details
Closed on
Aug 12, 1994
Sold by
Milota Barbara
Bought by
Hastings Scott A and Hastings Kim M
Home Financials for this Owner
Home Financials are based on the most recent Mortgage that was taken out on this home.
Original Mortgage
$179,117
Interest Rate
8.62%
Mortgage Type
VA
Create a Home Valuation Report for This Property
The Home Valuation Report is an in-depth analysis detailing your home's value as well as a comparison with similar homes in the area
Home Values in the Area
Average Home Value in this Area
Purchase History
| Date | Buyer | Sale Price | Title Company |
|---|---|---|---|
| Stefanik Dorothy M | $236,000 | Cleveland Home Title Agency | |
| Hastings Scott A | $173,900 | -- |
Source: Public Records
Mortgage History
| Date | Status | Borrower | Loan Amount |
|---|---|---|---|
| Open | Stefanik Dorothy M | $141,000 | |
| Previous Owner | Hastings Scott A | $179,117 |
Source: Public Records
Tax History Compared to Growth
Tax History
| Year | Tax Paid | Tax Assessment Tax Assessment Total Assessment is a certain percentage of the fair market value that is determined by local assessors to be the total taxable value of land and additions on the property. | Land | Improvement |
|---|---|---|---|---|
| 2024 | $7,015 | $148,250 | $35,844 | $112,406 |
| 2023 | $5,221 | $98,161 | $22,260 | $75,901 |
| 2022 | $5,167 | $98,161 | $22,260 | $75,901 |
| 2021 | $5,155 | $98,161 | $22,260 | $75,901 |
| 2020 | $5,082 | $89,650 | $20,330 | $69,320 |
| 2019 | $5,055 | $89,650 | $20,330 | $69,320 |
| 2018 | $5,002 | $89,650 | $20,330 | $69,320 |
| 2017 | $4,933 | $80,270 | $24,490 | $55,780 |
| 2016 | $4,908 | $80,270 | $24,490 | $55,780 |
| 2015 | $4,932 | $80,270 | $24,490 | $55,780 |
| 2014 | $4,880 | $75,710 | $23,100 | $52,610 |
| 2013 | $4,918 | $75,710 | $23,100 | $52,610 |
Source: Public Records
Map
Nearby Homes
- 330 Inwood Blvd
- 32863 Redwood Blvd
- 34 Community Dr Unit 34
- 230 Glenview Dr
- 30 Landings Way Unit 30
- 80 Landings Way Unit 80
- 32651 Walker Rd
- 32581 Captains Galley
- 32831 Sorrento Ln
- 417 Armour Rd
- 462 Caravel Ct
- 442 Caravel Ct
- 423 Clipper Ct
- 126 Parkwood Ave
- 33352 Midship Dr
- 346 Waterside Dr
- Prestige Plan at Port West - Retreat
- Palmary Plan at Port West - Retreat
- Mystique Plan at Port West - Retreat
- Prosperity Plan at Port West - Retreat
- 32803 Coventry Ct
- 32812 Coventry Ct
- 32797 Coventry Ct
- 32802 Coventry Ct
- 327 Timberlane Dr
- 32796 Coventry Ct
- 323 Timberlane Dr
- 32789 Coventry Ct
- 347 Timberlane Dr
- 319 Timberlane Dr
- 317 Timberlane Dr
- 32787 Briarwood Ct
- 32788 Coventry Ct
- 353 Timberlane Dr
- 32781 Briarwood Ct
- 32781 Coventry Ct
- 32795 Briarwood Ct
- 330 Timberlane Dr
- 32780 Coventry Ct
- 328 Timberlane Dr