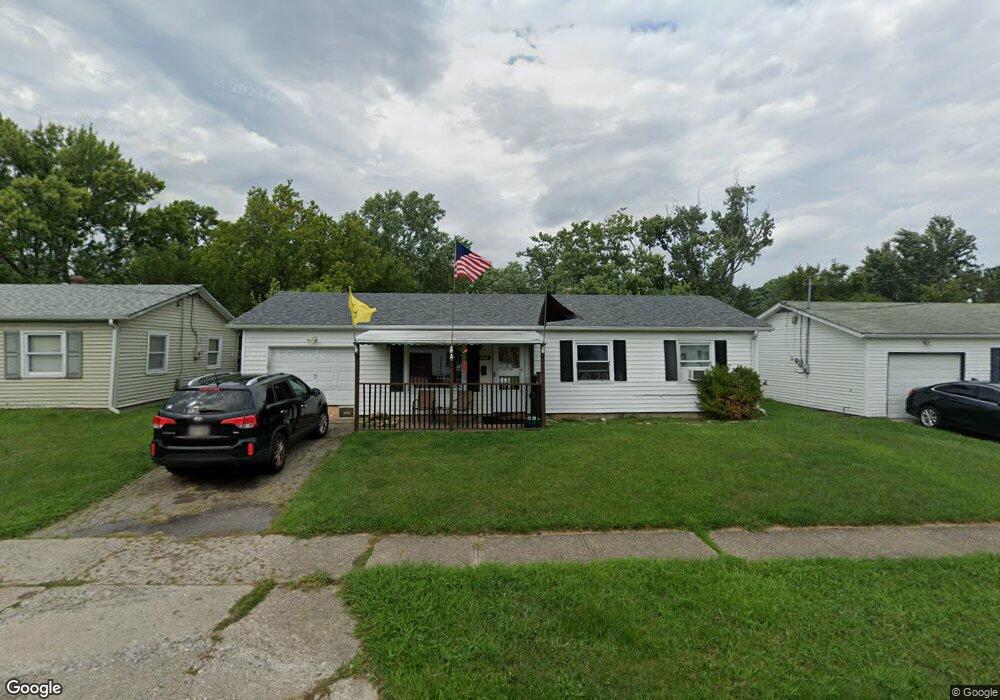
3282 Deshler Dr Cincinnati, OH 45251
Estimated Value: $133,000 - $159,844
3
Beds
1
Bath
925
Sq Ft
$159/Sq Ft
Est. Value
About This Home
This home is located at 3282 Deshler Dr, Cincinnati, OH 45251 and is currently estimated at $146,711, approximately $158 per square foot. 3282 Deshler Dr is a home located in Hamilton County with nearby schools including Taylor Elementary School, Pleasant Run Elementary School, and Pleasant Run Middle School.
Ownership History
Date
Name
Owned For
Owner Type
Purchase Details
Closed on
Jan 4, 2010
Sold by
Held John J
Bought by
Ohmer Robert L and Oher Sharon A
Current Estimated Value
Home Financials for this Owner
Home Financials are based on the most recent Mortgage that was taken out on this home.
Original Mortgage
$48,150
Outstanding Balance
$30,925
Interest Rate
4.84%
Mortgage Type
Unknown
Estimated Equity
$115,786
Purchase Details
Closed on
Dec 10, 2009
Sold by
Estate Of Shirley J Held
Bought by
Held John J
Home Financials for this Owner
Home Financials are based on the most recent Mortgage that was taken out on this home.
Original Mortgage
$48,150
Outstanding Balance
$30,925
Interest Rate
4.84%
Mortgage Type
Unknown
Estimated Equity
$115,786
Purchase Details
Closed on
Dec 3, 1999
Sold by
Judson Held John and Judson Shirley
Bought by
Held John J and Held Shirley
Create a Home Valuation Report for This Property
The Home Valuation Report is an in-depth analysis detailing your home's value as well as a comparison with similar homes in the area
Home Values in the Area
Average Home Value in this Area
Purchase History
| Date | Buyer | Sale Price | Title Company |
|---|---|---|---|
| Ohmer Robert L | $53,500 | Attorney | |
| Held John J | -- | None Available | |
| Held John J | -- | -- |
Source: Public Records
Mortgage History
| Date | Status | Borrower | Loan Amount |
|---|---|---|---|
| Open | Ohmer Robert L | $48,150 |
Source: Public Records
Tax History
| Year | Tax Paid | Tax Assessment Tax Assessment Total Assessment is a certain percentage of the fair market value that is determined by local assessors to be the total taxable value of land and additions on the property. | Land | Improvement |
|---|---|---|---|---|
| 2025 | $2,179 | $36,768 | $8,505 | $28,263 |
| 2023 | $2,052 | $36,768 | $8,505 | $28,263 |
| 2022 | $1,646 | $24,088 | $7,501 | $16,587 |
| 2021 | $1,662 | $24,088 | $7,501 | $16,587 |
| 2020 | $1,642 | $24,088 | $7,501 | $16,587 |
| 2019 | $1,429 | $19,425 | $6,048 | $13,377 |
| 2018 | $1,286 | $19,425 | $6,048 | $13,377 |
| 2017 | $1,237 | $19,425 | $6,048 | $13,377 |
| 2016 | $1,160 | $17,787 | $6,104 | $11,683 |
| 2015 | $1,155 | $17,787 | $6,104 | $11,683 |
| 2014 | $1,158 | $17,787 | $6,104 | $11,683 |
| 2013 | $1,109 | $18,725 | $6,426 | $12,299 |
Source: Public Records
Map
Nearby Homes
- 3252 Deshler Dr
- 3261 Deshler Dr
- 9753 Stadia Dr
- 3215 Orangeburg Ct
- 3287 Niagara St
- 9821 Mel Carl Dr
- 3364 Hidden Creek Dr
- 3420 Grovewood Dr
- 9862 Dunlap Dr
- 3484 Niagara St
- 3419 Niagara St
- 3225 Heritage Square Dr
- 9570 Stateland Ct
- 3123 Niagara St
- 3111 Niagara St
- 3211 Heritage Square Dr
- 3099 Niagara St
- 3424 Sunbury Ln
- 9457 Willowgate Dr
- 3013 Niagara St
- 3286 Deshler Dr
- 3272 Deshler Dr
- 3279 Coleen Dr
- 3285 Coleen Dr
- 3273 Coleen Dr
- 9754 Stadia Dr
- 9776 Stadia Dr
- 3281 Deshler Dr
- 3267 Coleen Dr
- 3266 Deshler Dr
- 3285 Deshler Dr
- 9798 Stadia Dr
- 3271 Deshler Dr
- 9748 Stadia Dr
- 3261 Coleen Dr
- 3262 Deshler Dr
- 3265 Deshler Dr
- 9726 Stadia Dr
- 3282 Ainsworth Dr
- 3282 Coleen Dr
Your Personal Tour Guide
Ask me questions while you tour the home.