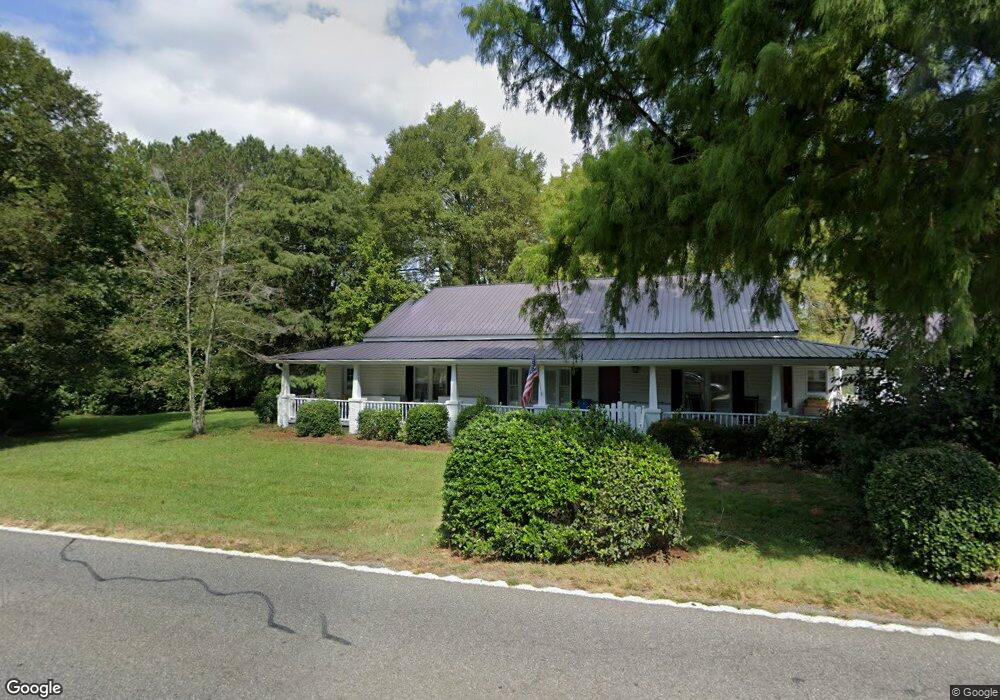
3282 Red Bud Rd NE Calhoun, GA 30701
Estimated Value: $317,946 - $373,000
3
Beds
1
Bath
1,848
Sq Ft
$185/Sq Ft
Est. Value
About This Home
This home is located at 3282 Red Bud Rd NE, Calhoun, GA 30701 and is currently estimated at $341,737, approximately $184 per square foot. 3282 Red Bud Rd NE is a home located in Gordon County with nearby schools including Red Bud Elementary School, Red Bud Middle School, and Sonoraville High School.
Ownership History
Date
Name
Owned For
Owner Type
Purchase Details
Closed on
Jan 20, 2006
Sold by
Roland Zachary B
Bought by
Roland Wallace Lanier and Roland Susan D
Current Estimated Value
Home Financials for this Owner
Home Financials are based on the most recent Mortgage that was taken out on this home.
Original Mortgage
$153,600
Outstanding Balance
$86,028
Interest Rate
6.21%
Mortgage Type
New Conventional
Estimated Equity
$255,709
Purchase Details
Closed on
Jan 7, 2003
Sold by
Sullivan Billy J and Sulli Joy C
Bought by
Roland Zachary B and Roland Katherine B
Purchase Details
Closed on
Feb 19, 2001
Sold by
Baxter Brian Etal
Bought by
Sullivan Billy J and Sullivan Joy C
Purchase Details
Closed on
Oct 12, 2000
Sold by
Carden Mary G
Bought by
Baxter Brian Etal
Purchase Details
Closed on
Sep 10, 1999
Bought by
Carden Mary G
Purchase Details
Closed on
Jul 15, 1991
Bought by
Gentry David and Carder Mary G
Create a Home Valuation Report for This Property
The Home Valuation Report is an in-depth analysis detailing your home's value as well as a comparison with similar homes in the area
Home Values in the Area
Average Home Value in this Area
Purchase History
| Date | Buyer | Sale Price | Title Company |
|---|---|---|---|
| Roland Wallace Lanier | $192,000 | -- | |
| Roland Zachary B | $107,000 | -- | |
| Sullivan Billy J | -- | -- | |
| Baxter Brian Etal | $155,000 | -- | |
| Carden Mary G | -- | -- | |
| Gentry David | -- | -- |
Source: Public Records
Mortgage History
| Date | Status | Borrower | Loan Amount |
|---|---|---|---|
| Open | Roland Wallace Lanier | $153,600 |
Source: Public Records
Tax History Compared to Growth
Tax History
| Year | Tax Paid | Tax Assessment Tax Assessment Total Assessment is a certain percentage of the fair market value that is determined by local assessors to be the total taxable value of land and additions on the property. | Land | Improvement |
|---|---|---|---|---|
| 2024 | $1,685 | $92,816 | $18,360 | $74,456 |
| 2023 | $1,572 | $88,340 | $18,360 | $69,980 |
| 2022 | $2,060 | $76,260 | $10,040 | $66,220 |
| 2021 | $1,683 | $60,068 | $9,120 | $50,948 |
| 2020 | $1,628 | $56,832 | $9,120 | $47,712 |
| 2019 | $1,637 | $56,832 | $9,120 | $47,712 |
| 2018 | $1,747 | $60,664 | $9,120 | $51,544 |
| 2017 | $1,726 | $58,224 | $9,120 | $49,104 |
| 2016 | $1,729 | $58,224 | $9,120 | $49,104 |
| 2015 | $1,722 | $57,424 | $9,120 | $48,304 |
| 2014 | $1,623 | $55,744 | $9,137 | $46,607 |
Source: Public Records
Map
Nearby Homes
- 121 Harrison Ln NE
- 127 Telluride Trail NE
- 158 Brooksmill Dr NE
- 379 Owens Cir NE
- 00 Hunts Gin Rd L2
- 1535 Hunts Gin Rd
- LOT 4 Hunts Gin Rd
- 0 Hunts Gin Rd L2
- 119 Windy Hill Rd SE
- 137 Wendy Hill Rd SE
- 00002 Lovebridge Rd SE
- lot 4 Lovebridge Rd SE
- 320 School House Rd NE
- 130 Burnt Hickory Ln SE
- 0 Woodedge Dr NE Unit 7661757
- 0 Woodedge Dr NE Unit LOT 36
- 225 Lovebridge Dr SE
- 367 School House Rd NE
- 624 Newtown Creek Loop NE
- 279 Baker Rd SE
- 3217 Red Bud Rd NE
- 196 Aubrey Ave NE
- 186 Aubrey Ave NE
- 204 Aubrey Ave NE
- 172 Aubrey Ave NE
- 3238 Red Bud Rd NE
- 214 Aubrey
- 169 Aubrey Ave NE
- 3360 Red Bud Rd NE
- 3414 Red Bud Rd NE
- 220 Aubrey Ave NE
- 156 Aubrey Ave NE
- 213 Aubrey Ave NE
- 213 Aubrey Ave NE
- 151 Aubrey Ave NE
- 224 Aubrey Ave NE
- 3389 Red Bud Rd NE
- 137 Aubrey Ave NE
- 123 Brianna Blvd NE
- 3398 Red Bud Rd NE