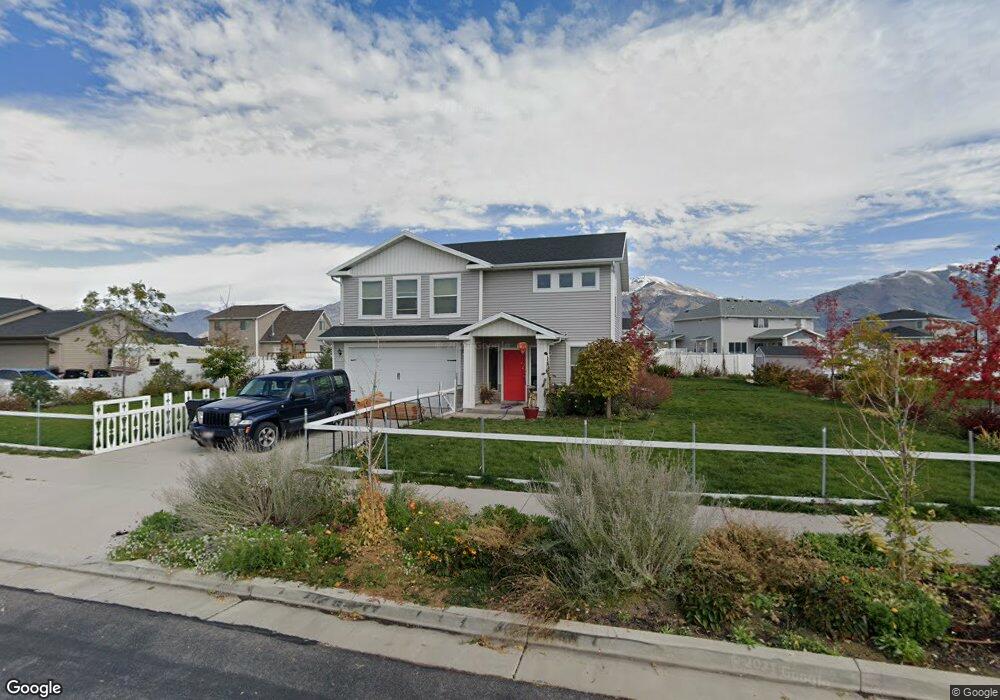
3282 S 1380 W Nibley, UT 84321
Estimated Value: $472,000 - $495,000
3
Beds
3
Baths
1,863
Sq Ft
$259/Sq Ft
Est. Value
About This Home
This home is located at 3282 S 1380 W, Nibley, UT 84321 and is currently estimated at $482,181, approximately $258 per square foot. 3282 S 1380 W is a home located in Cache County with nearby schools including Heritage School, South Cache Middle School, and Spring Creek Middle School.
Ownership History
Date
Name
Owned For
Owner Type
Purchase Details
Closed on
May 8, 2020
Sold by
Bunnell Shawn T and Bunnell Emily E
Bought by
Last Annmarie
Current Estimated Value
Home Financials for this Owner
Home Financials are based on the most recent Mortgage that was taken out on this home.
Original Mortgage
$303,030
Outstanding Balance
$268,953
Interest Rate
3.5%
Mortgage Type
FHA
Estimated Equity
$213,228
Purchase Details
Closed on
Apr 25, 2014
Sold by
Mv Properties Llc
Bought by
Bunnell Shawn T and Bunnell Emily E
Home Financials for this Owner
Home Financials are based on the most recent Mortgage that was taken out on this home.
Original Mortgage
$188,875
Interest Rate
4.32%
Mortgage Type
VA
Create a Home Valuation Report for This Property
The Home Valuation Report is an in-depth analysis detailing your home's value as well as a comparison with similar homes in the area
Home Values in the Area
Average Home Value in this Area
Purchase History
| Date | Buyer | Sale Price | Title Company |
|---|---|---|---|
| Last Annmarie | -- | Inwest Title | |
| Bunnell Shawn T | -- | American Secure Title Logan |
Source: Public Records
Mortgage History
| Date | Status | Borrower | Loan Amount |
|---|---|---|---|
| Open | Last Annmarie | $303,030 | |
| Previous Owner | Bunnell Shawn T | $188,875 |
Source: Public Records
Tax History Compared to Growth
Tax History
| Year | Tax Paid | Tax Assessment Tax Assessment Total Assessment is a certain percentage of the fair market value that is determined by local assessors to be the total taxable value of land and additions on the property. | Land | Improvement |
|---|---|---|---|---|
| 2025 | $1,981 | $262,610 | $0 | $0 |
| 2024 | $2,115 | $263,230 | $0 | $0 |
| 2023 | $2,216 | $258,225 | $0 | $0 |
| 2022 | $2,306 | $258,225 | $0 | $0 |
| 2021 | $1,755 | $305,190 | $60,000 | $245,190 |
| 2020 | $1,651 | $273,209 | $60,000 | $213,209 |
| 2019 | $1,731 | $273,208 | $60,000 | $213,208 |
| 2018 | $1,496 | $230,365 | $40,000 | $190,365 |
| 2017 | $1,492 | $121,715 | $0 | $0 |
| 2016 | $1,509 | $100,870 | $0 | $0 |
| 2015 | $1,243 | $100,870 | $0 | $0 |
| 2014 | $761 | $63,250 | $0 | $0 |
Source: Public Records
Map
Nearby Homes