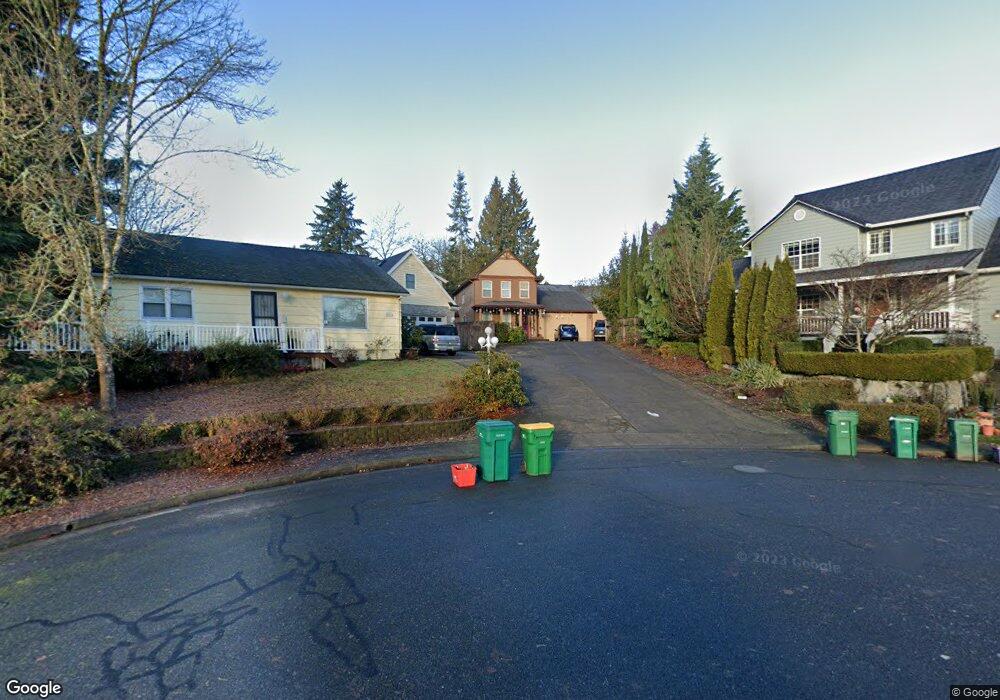
32821 SW Crystal Springs Ct Scappoose, OR 97056
Estimated Value: $530,000 - $565,000
3
Beds
3
Baths
2,125
Sq Ft
$256/Sq Ft
Est. Value
About This Home
This home is located at 32821 SW Crystal Springs Ct, Scappoose, OR 97056 and is currently estimated at $543,950, approximately $255 per square foot. 32821 SW Crystal Springs Ct is a home located in Columbia County with nearby schools including Scappoose High School and Scappoose Adventist School.
Ownership History
Date
Name
Owned For
Owner Type
Purchase Details
Closed on
Dec 11, 2020
Sold by
Warneke Douglas W and Warneke Kristine S
Bought by
Warneke Douglas W and Warneke Kristine S
Current Estimated Value
Home Financials for this Owner
Home Financials are based on the most recent Mortgage that was taken out on this home.
Original Mortgage
$171,200
Outstanding Balance
$122,515
Interest Rate
2.7%
Mortgage Type
New Conventional
Estimated Equity
$421,435
Purchase Details
Closed on
Aug 1, 2019
Sold by
Warneke Douglas W and Warneke Kristine S
Bought by
Warneke Douglas W and Warneke Kristine S
Purchase Details
Closed on
Sep 7, 2007
Sold by
Warneke Douglas W and Warneke Kristine S
Bought by
Denson David Cooper and Denson Robin L
Purchase Details
Closed on
Aug 21, 2001
Bought by
Warneke Douglas W and Warneke Kristine S
Create a Home Valuation Report for This Property
The Home Valuation Report is an in-depth analysis detailing your home's value as well as a comparison with similar homes in the area
Home Values in the Area
Average Home Value in this Area
Purchase History
| Date | Buyer | Sale Price | Title Company |
|---|---|---|---|
| Warneke Douglas W | -- | Ticor Title Company Of Or | |
| Warneke Douglas W | -- | None Available | |
| Denson David Cooper | -- | Ticor Title | |
| Warneke Douglas W | $250,000 | -- |
Source: Public Records
Mortgage History
| Date | Status | Borrower | Loan Amount |
|---|---|---|---|
| Open | Warneke Douglas W | $171,200 |
Source: Public Records
Tax History Compared to Growth
Tax History
| Year | Tax Paid | Tax Assessment Tax Assessment Total Assessment is a certain percentage of the fair market value that is determined by local assessors to be the total taxable value of land and additions on the property. | Land | Improvement |
|---|---|---|---|---|
| 2025 | $5,028 | $305,380 | $108,610 | $196,770 |
| 2024 | $4,889 | $296,490 | $105,450 | $191,040 |
| 2023 | $4,843 | $287,860 | $107,030 | $180,830 |
| 2022 | $4,639 | $279,480 | $103,910 | $175,570 |
| 2021 | $4,506 | $271,340 | $110,690 | $160,650 |
| 2020 | $4,179 | $263,440 | $102,430 | $161,010 |
| 2019 | $4,070 | $255,770 | $98,510 | $157,260 |
| 2018 | $3,977 | $248,330 | $112,140 | $136,190 |
| 2017 | $3,906 | $241,100 | $108,870 | $132,230 |
| 2016 | $3,856 | $234,080 | $105,690 | $128,390 |
| 2015 | $3,620 | $227,270 | $80,110 | $147,160 |
| 2014 | $3,569 | $220,660 | $70,990 | $149,670 |
Source: Public Records
Map
Nearby Homes
- 32839 SW Crystal Springs Ct
- 32898 SW Keys Landing Way
- 32922 Coal Creek Rd
- 33344 SW Rokin Way
- 33358 SW Rokin Way
- 33363 SW Rokin Way
- 33375 SW Rokin Way
- 33370 SW Rokin Way
- 32373 Jp West Rd
- 32904 NW View Terrace Place
- 51557 SW Em Watts Rd
- 51925 Columbia River Hwy
- 33279 SW Havlik Dr
- 32952 NW Ridge Dr
- 33298 SW Meadowbrook Dr
- 33399 NW Ej Smith Rd
- 33374 Wickstrom Dr
- 33410 Meadowbrook Dr
- 51350 SW Randstad St
- 51692 SE 3rd St
- 32816 SW Crystal Springs Ct
- 32829 SW Crystal Springs Ct
- 32818 SW Huser Ln
- 32808 SW Huser Ln
- 32824 SW Crystal Springs Ct
- 32798 SW Huser Ln
- 32830 SW Huser Ln
- 0 SW Crystal Springs Ct
- 32839 SW Crystal Springs Ct Unit LOT 1
- 52159 SW Keys Rd
- 32840 SW Huser Ln
- 32788 SW Huser Ln
- 32846 SW Crystal Springs Ct
- 32815 SW Huser Ln
- 52219 SW Keys Rd
- 32778 SW Huser Ln
- 32793 SW Huser Ln
- 32811 SW Huser Ln
- 32807 SW Huser Ln
- 32775 Huser Ln