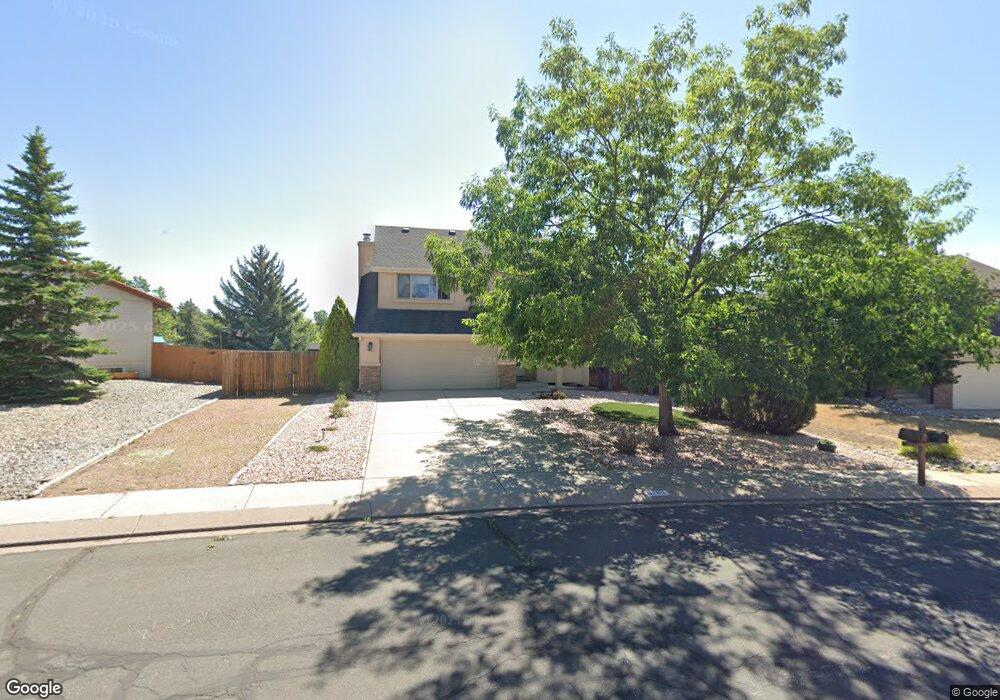
3285 Navigation Dr Colorado Springs, CO 80920
Briargate NeighborhoodEstimated Value: $454,000 - $488,000
3
Beds
2
Baths
1,441
Sq Ft
$330/Sq Ft
Est. Value
About This Home
This home is located at 3285 Navigation Dr, Colorado Springs, CO 80920 and is currently estimated at $475,477, approximately $329 per square foot. 3285 Navigation Dr is a home located in El Paso County with nearby schools including High Plains Elementary School, Mountain Ridge Middle School, and Rampart High School.
Ownership History
Date
Name
Owned For
Owner Type
Purchase Details
Closed on
Sep 18, 2019
Sold by
Sandgren John H and Sandgren Bonita B
Bought by
Parrett Patricia L
Current Estimated Value
Purchase Details
Closed on
Nov 23, 2016
Sold by
Sandgren John H
Bought by
Sandgren John H and Sandgren Bonita B
Home Financials for this Owner
Home Financials are based on the most recent Mortgage that was taken out on this home.
Original Mortgage
$55,000
Interest Rate
3.54%
Mortgage Type
New Conventional
Purchase Details
Closed on
Jan 1, 1989
Bought by
Sandgren Bonita B
Purchase Details
Closed on
Jan 1, 1988
Bought by
Sandgren John H
Purchase Details
Closed on
Dec 1, 1984
Bought by
Sandgren John H
Create a Home Valuation Report for This Property
The Home Valuation Report is an in-depth analysis detailing your home's value as well as a comparison with similar homes in the area
Home Values in the Area
Average Home Value in this Area
Purchase History
| Date | Buyer | Sale Price | Title Company |
|---|---|---|---|
| Parrett Patricia L | $326,000 | Capital Title | |
| Sandgren John H | -- | None Available | |
| Sandgren Bonita B | -- | -- | |
| Sandgren John H | -- | -- | |
| Sandgren John H | -- | -- |
Source: Public Records
Mortgage History
| Date | Status | Borrower | Loan Amount |
|---|---|---|---|
| Previous Owner | Sandgren John H | $55,000 |
Source: Public Records
Tax History Compared to Growth
Tax History
| Year | Tax Paid | Tax Assessment Tax Assessment Total Assessment is a certain percentage of the fair market value that is determined by local assessors to be the total taxable value of land and additions on the property. | Land | Improvement |
|---|---|---|---|---|
| 2025 | $1,845 | $31,490 | -- | -- |
| 2024 | $1,845 | $32,560 | $6,700 | $25,860 |
| 2022 | $1,553 | $22,000 | $5,420 | $16,580 |
| 2021 | $1,618 | $22,640 | $5,580 | $17,060 |
| 2020 | $1,455 | $18,900 | $4,650 | $14,250 |
| 2019 | $895 | $18,900 | $4,650 | $14,250 |
| 2018 | $677 | $15,940 | $3,600 | $12,340 |
| 2017 | $675 | $15,940 | $3,600 | $12,340 |
| 2016 | $585 | $15,140 | $3,660 | $11,480 |
| 2015 | $584 | $15,140 | $3,660 | $11,480 |
| 2014 | $1,083 | $14,020 | $3,660 | $10,360 |
Source: Public Records
Map
Nearby Homes
- 8112 Old Exchange Dr
- 8213 Caravel Dr
- 3142 Soaring Bird Cir
- 3326 Soaring Bird Cir
- 3690 Amelia Island St
- 8335 Saint Helena Dr
- 3746 St Simons Ct
- 8020 Cooper River Dr
- 8118 Ravenel Dr
- 8261 Cooper River Dr
- 3665 Birnamwood Dr
- 3339 Union Jack Way
- 2768 Thrush Grove
- 8935 Coberdale Ct
- 2656 Marston Heights
- 8702 Alpine Valley Dr
- 7870 Chimney Terrace
- 2644 Marston Heights
- 2730 Kenton Green Ct
- 8735 Chapel Square Ct
- 3275 Navigation Dr
- 3245 Windjammer Dr
- 3255 Windjammer Dr
- 3265 Navigation Dr
- 3225 Windjammer Dr
- 3255 Navigation Dr
- 3265 Windjammer Dr
- 3270 Navigation Dr
- 3240 Windjammer Dr
- 3230 Windjammer Dr
- 3215 Windjammer Dr
- 3245 Navigation Dr
- 8120 Old Exchange Dr
- 8104 Old Exchange Dr
- 3220 Windjammer Dr
- 3260 Navigation Dr
- 3250 Windjammer Dr
- 8128 Old Exchange Dr
- 8096 Old Exchange Dr
- 8315 Tiller Ct