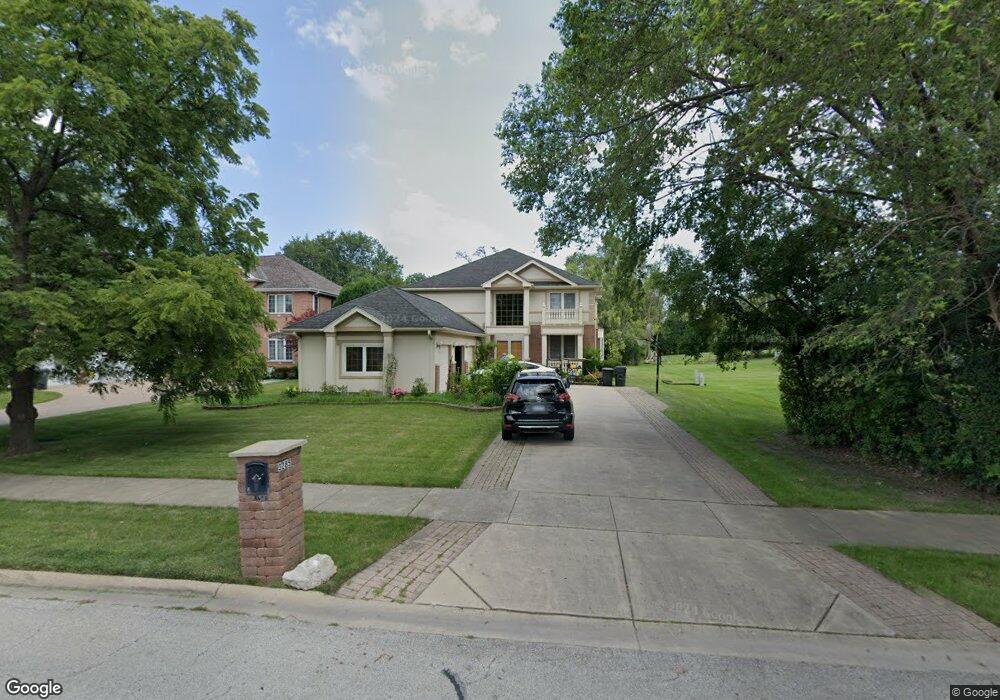
3285 Potter Rd Glenview, IL 60026
Estimated Value: $1,154,000 - $1,687,000
5
Beds
4
Baths
4,693
Sq Ft
$289/Sq Ft
Est. Value
About This Home
This home is located at 3285 Potter Rd, Glenview, IL 60026 and is currently estimated at $1,354,887, approximately $288 per square foot. 3285 Potter Rd is a home located in Cook County with nearby schools including Henry Winkelman Elementary School, Field Middle School, and Glenbrook South High School.
Ownership History
Date
Name
Owned For
Owner Type
Purchase Details
Closed on
Jun 17, 2016
Sold by
Sunny Joseph Mercy and Sunny Joseph
Bought by
Joseph Mercy P and Joseph Sunny P
Current Estimated Value
Purchase Details
Closed on
Jun 9, 2016
Sold by
Sunny Joseph Mercy and Sunny Joseph
Bought by
Joseph Mercy
Purchase Details
Closed on
Mar 4, 2004
Sold by
Kim Max H and Kim Bonnie
Bought by
Mercy Joseph Sunny and Mercy Joseph
Home Financials for this Owner
Home Financials are based on the most recent Mortgage that was taken out on this home.
Original Mortgage
$333,700
Interest Rate
6.37%
Mortgage Type
Unknown
Purchase Details
Closed on
Mar 29, 2001
Sold by
Zasadzien Peter
Bought by
Kim Max H and Kim Bonnie
Home Financials for this Owner
Home Financials are based on the most recent Mortgage that was taken out on this home.
Original Mortgage
$498,000
Interest Rate
7.13%
Purchase Details
Closed on
May 8, 1998
Sold by
Gale John W and Gale Jill R
Bought by
Zazadzien Peter
Create a Home Valuation Report for This Property
The Home Valuation Report is an in-depth analysis detailing your home's value as well as a comparison with similar homes in the area
Home Values in the Area
Average Home Value in this Area
Purchase History
| Date | Buyer | Sale Price | Title Company |
|---|---|---|---|
| Joseph Mercy P | -- | None Available | |
| Joseph Mercy | -- | None Available | |
| Mercy Joseph Sunny | $930,000 | Cti | |
| Kim Max H | $780,000 | -- | |
| Zazadzien Peter | $206,000 | -- |
Source: Public Records
Mortgage History
| Date | Status | Borrower | Loan Amount |
|---|---|---|---|
| Previous Owner | Mercy Joseph Sunny | $333,700 | |
| Previous Owner | Kim Max H | $498,000 |
Source: Public Records
Tax History
| Year | Tax Paid | Tax Assessment Tax Assessment Total Assessment is a certain percentage of the fair market value that is determined by local assessors to be the total taxable value of land and additions on the property. | Land | Improvement |
|---|---|---|---|---|
| 2025 | $18,363 | $131,000 | $16,044 | $114,956 |
| 2024 | $18,363 | $91,348 | $18,718 | $72,630 |
| 2023 | $18,802 | $91,348 | $18,718 | $72,630 |
| 2022 | $18,802 | $91,348 | $18,718 | $72,630 |
| 2021 | $15,641 | $66,588 | $16,044 | $50,544 |
| 2020 | $16,084 | $71,234 | $16,044 | $55,190 |
| 2019 | $17,270 | $86,157 | $16,044 | $70,113 |
| 2018 | $17,451 | $79,740 | $14,038 | $65,702 |
| 2017 | $16,966 | $79,740 | $14,038 | $65,702 |
| 2016 | $17,404 | $84,860 | $14,038 | $70,822 |
| 2015 | $16,206 | $71,434 | $11,364 | $60,070 |
| 2014 | $15,773 | $71,434 | $11,364 | $60,070 |
| 2013 | $15,426 | $71,434 | $11,364 | $60,070 |
Source: Public Records
Map
Nearby Homes
- 4408 Hammersmith Ln
- 2308 Indian Ridge Dr
- 3404 Salem Walk
- 3428 Salem Walk
- 3456 Salem Walk
- 3246 Landwehr Rd Unit 3
- 3190 Landwehr Rd
- 3606 Salem Walk
- 4142 Hampton Ct
- 3250 Sanders Rd Unit 10C
- 3266 Sanders Rd Unit 6F
- 3856 S Parkway Dr Unit 3B
- 2501 Indian Ridge Dr
- 4715 W Lake Ave
- 1594 Portage Run
- 3240 Brookdale Ln
- 3800 Kiess Dr
- 2803 Wildflower Ct
- 3806 Michael Ln
- 1223 Milwaukee Ave
- 3267 Potter Rd
- 4330 Hammersmith Ln
- 4328 Hammersmith Ln
- 3265 Potter Rd
- 3445 Crescent Ln
- 3445 Crescent Ln
- 4324 Hammersmith Ln
- 4403 Crescent Ln
- 3280 Potter Rd
- 3280 Potter Rd
- 3435 Crescent Ln
- 3290 Potter Rd
- 3290 Potter Rd
- 4322 Hammersmith Ln
- 3480 Crescent Ln
- 4402 Hammersmith Ln
- 4402 Hammersmith Ln Unit 4402
- 4400 Crescent Ln
- 4401 Crescent Ln
- 3335 Potter Rd
Your Personal Tour Guide
Ask me questions while you tour the home.