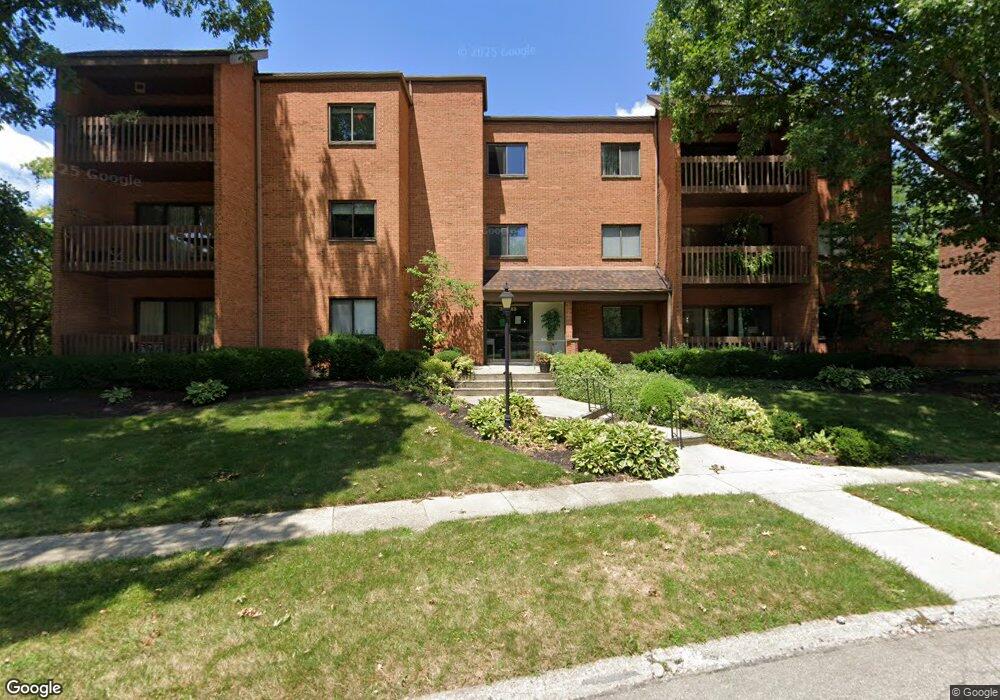
3285 Southdale Dr Unit 6 Dayton, OH 45409
Estimated Value: $138,000 - $162,999
2
Beds
2
Baths
1,156
Sq Ft
$130/Sq Ft
Est. Value
About This Home
This home is located at 3285 Southdale Dr Unit 6, Dayton, OH 45409 and is currently estimated at $149,750, approximately $129 per square foot. 3285 Southdale Dr Unit 6 is a home located in Montgomery County with nearby schools including Southdale Elementary School, Van Buren Middle School, and Kettering Fairmont High School.
Ownership History
Date
Name
Owned For
Owner Type
Purchase Details
Closed on
Apr 16, 2021
Sold by
Kasers Inc
Bought by
Mccabe Holdings Llc
Current Estimated Value
Purchase Details
Closed on
Jun 2, 2020
Sold by
Kaser Delphine A and Kaser Mark L
Bought by
Kasers Inc
Purchase Details
Closed on
May 16, 2019
Sold by
Bank Of America National Association
Bought by
Kaser Delphine A
Purchase Details
Closed on
Aug 6, 2018
Sold by
Clark Donna Lee and Cit Bank N A
Bought by
Bank Of America Na
Purchase Details
Closed on
Dec 4, 2003
Sold by
Wilson Eileen P
Bought by
Clark Paul T and Clark Donna Lee
Home Financials for this Owner
Home Financials are based on the most recent Mortgage that was taken out on this home.
Original Mortgage
$59,200
Interest Rate
6.04%
Mortgage Type
Purchase Money Mortgage
Create a Home Valuation Report for This Property
The Home Valuation Report is an in-depth analysis detailing your home's value as well as a comparison with similar homes in the area
Home Values in the Area
Average Home Value in this Area
Purchase History
| Date | Buyer | Sale Price | Title Company |
|---|---|---|---|
| Mccabe Holdings Llc | $105,500 | Fidelity Lawyers Ttl Agcy Ll | |
| Kasers Inc | -- | Landmark Ttl Agcy South Inc | |
| Kaser Delphine A | $57,750 | Landmark Ttl Agcy South Inc | |
| Bank Of America Na | $55,000 | None Available | |
| Clark Paul T | $74,000 | The Hallmark Title Agency In |
Source: Public Records
Mortgage History
| Date | Status | Borrower | Loan Amount |
|---|---|---|---|
| Previous Owner | Clark Paul T | $59,200 |
Source: Public Records
Tax History Compared to Growth
Tax History
| Year | Tax Paid | Tax Assessment Tax Assessment Total Assessment is a certain percentage of the fair market value that is determined by local assessors to be the total taxable value of land and additions on the property. | Land | Improvement |
|---|---|---|---|---|
| 2024 | $2,572 | $40,480 | $8,190 | $32,290 |
| 2023 | $2,572 | $40,480 | $8,190 | $32,290 |
| 2022 | $2,476 | $30,820 | $6,160 | $24,660 |
| 2021 | $2,294 | $30,820 | $6,160 | $24,660 |
| 2020 | $2,301 | $30,820 | $6,160 | $24,660 |
| 2019 | $2,267 | $27,420 | $6,160 | $21,260 |
| 2018 | $1,560 | $27,420 | $6,160 | $21,260 |
| 2017 | $1,438 | $27,420 | $6,160 | $21,260 |
| 2016 | $1,188 | $23,190 | $6,160 | $17,030 |
| 2015 | $1,133 | $23,190 | $6,160 | $17,030 |
| 2014 | $1,133 | $23,190 | $6,160 | $17,030 |
| 2012 | -- | $29,300 | $6,160 | $23,140 |
Source: Public Records
Map
Nearby Homes
- 3225 Southdale Dr Unit 1
- 1314 Ridgeview Ave
- 1554 Crescent Blvd
- 3060 Regent St
- 1424 Elmdale Dr
- 1129 W Dorothy Ln
- 1349 Tamerlane Rd
- 1364 Elmdale Dr
- 1151 Brookview Ave
- 1125 Laurelwood Rd
- 1545 Cardington Rd
- 3720 Ridgeleigh Rd Unit D
- 3464 Southern Blvd
- 1692 Hillwood Dr
- 1536 Old Lane Ave
- 1673 W Stroop Rd
- 1597 Old Lane Ave
- 2090 Mattis Dr
- 4005 Ellery Ave
- 4301 Tait Rd
- 3285 Southdale Dr Unit 10863
- 3285 Southdale Dr Unit 10862
- 3285 Southdale Dr Unit 10861
- 3285 Southdale Dr Unit 10860
- 3285 Southdale Dr Unit 10859
- 3285 Southdale Dr Unit 10858
- 3285 Southdale Dr Unit 10857
- 3285 Southdale Dr Unit 10856
- 3285 Southdale Dr Unit 10855
- 3285 Southdale Dr Unit 1
- 3285 Southdale Dr Unit 2
- 3285 Southdale Dr Unit 61
- 3285 Southdale Dr
- 3285 Southdale Dr Unit 60
- 3285 Southdale Dr Unit 3
- 3285 Southdale Dr Unit 5
- 3285 Southdale Dr Unit 7
- 3275 Southdale Dr Unit 49
- 3275 Southdale Dr Unit 3
- 3275 Southdale Dr Unit 10754