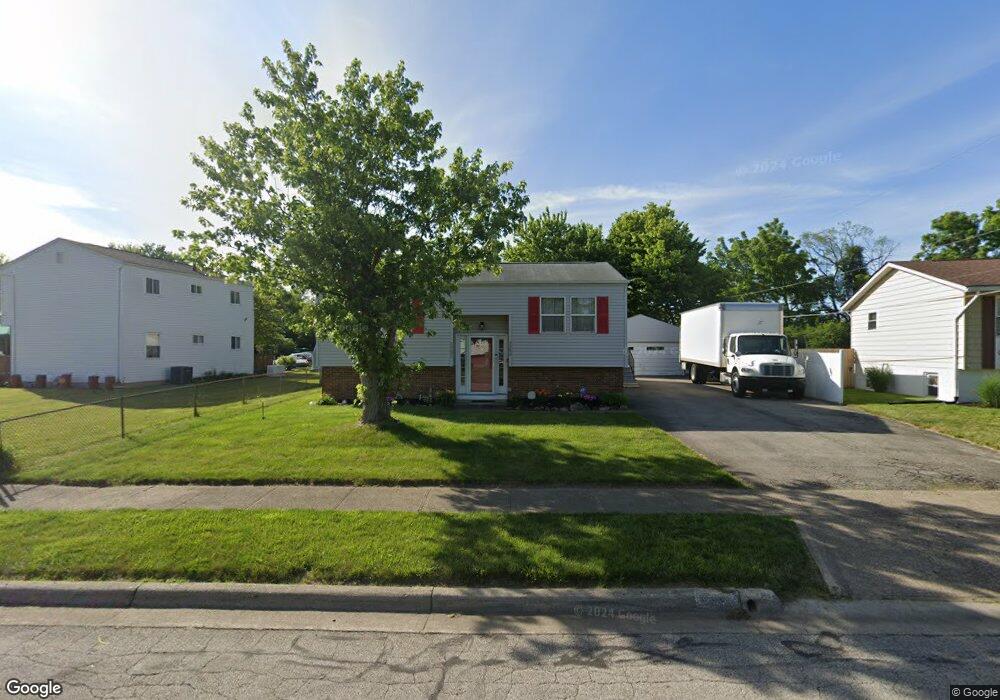
3286 Latonia Rd Columbus, OH 43232
East Columbus-White Ash NeighborhoodEstimated Value: $219,000 - $235,000
4
Beds
2
Baths
1,768
Sq Ft
$129/Sq Ft
Est. Value
About This Home
This home is located at 3286 Latonia Rd, Columbus, OH 43232 and is currently estimated at $227,748, approximately $128 per square foot. 3286 Latonia Rd is a home located in Franklin County with nearby schools including Groveport Madison High School, A+ Arts Academy, and Eastland Preparatory Academy.
Ownership History
Date
Name
Owned For
Owner Type
Purchase Details
Closed on
Jul 20, 2017
Sold by
Benson Linda G
Bought by
Benson Dale E
Current Estimated Value
Purchase Details
Closed on
Mar 5, 2002
Sold by
Goff Carlos
Bought by
Benson Linda G
Home Financials for this Owner
Home Financials are based on the most recent Mortgage that was taken out on this home.
Original Mortgage
$80,000
Outstanding Balance
$33,347
Interest Rate
7.03%
Estimated Equity
$194,401
Purchase Details
Closed on
Jun 13, 2001
Sold by
The Bank Of New York
Bought by
Goff Carlos
Home Financials for this Owner
Home Financials are based on the most recent Mortgage that was taken out on this home.
Original Mortgage
$75,286
Interest Rate
7.15%
Purchase Details
Closed on
Sep 25, 2000
Sold by
Exline Terry L
Bought by
Bank Of New York
Purchase Details
Closed on
Sep 9, 1997
Sold by
Exline Glenda J
Bought by
Exline Terry L
Purchase Details
Closed on
Jan 20, 1988
Create a Home Valuation Report for This Property
The Home Valuation Report is an in-depth analysis detailing your home's value as well as a comparison with similar homes in the area
Home Values in the Area
Average Home Value in this Area
Purchase History
| Date | Buyer | Sale Price | Title Company |
|---|---|---|---|
| Benson Dale E | -- | None Available | |
| Benson Linda G | $84,200 | Midland Celtic Title | |
| Goff Carlos | $55,800 | Midland Celtic Title | |
| Bank Of New York | $46,000 | -- | |
| Exline Terry L | -- | -- | |
| -- | $55,000 | -- |
Source: Public Records
Mortgage History
| Date | Status | Borrower | Loan Amount |
|---|---|---|---|
| Open | Benson Linda G | $80,000 | |
| Previous Owner | Goff Carlos | $75,286 |
Source: Public Records
Tax History Compared to Growth
Tax History
| Year | Tax Paid | Tax Assessment Tax Assessment Total Assessment is a certain percentage of the fair market value that is determined by local assessors to be the total taxable value of land and additions on the property. | Land | Improvement |
|---|---|---|---|---|
| 2024 | $3,516 | $72,700 | $16,100 | $56,600 |
| 2023 | $3,491 | $72,695 | $16,100 | $56,595 |
| 2022 | $2,385 | $39,420 | $6,690 | $32,730 |
| 2021 | $2,430 | $39,420 | $6,690 | $32,730 |
| 2020 | $2,436 | $39,420 | $6,690 | $32,730 |
| 2019 | $2,409 | $34,300 | $5,810 | $28,490 |
| 2018 | $2,336 | $34,300 | $5,810 | $28,490 |
| 2017 | $2,340 | $34,300 | $5,810 | $28,490 |
| 2016 | $2,245 | $28,630 | $4,340 | $24,290 |
| 2015 | $2,249 | $28,630 | $4,340 | $24,290 |
| 2014 | $2,072 | $28,630 | $4,340 | $24,290 |
| 2013 | $1,001 | $31,815 | $4,830 | $26,985 |
Source: Public Records
Map
Nearby Homes
- 3246 Latonia Rd
- 5152 Burdett Dr
- 5254 Sedalia Dr
- 3387 Retriever Rd
- 5397 Jack Russell Way
- 5391 Newport Rd
- 5522 Newport Ct
- 3496 Cadell Rd
- 4847 Amber Crossing Dr
- 5125 Upton Rd N
- 3567 Wymore Place
- 2998 Osgood Rd E
- 4784 Nieles Edge Dr
- 3773 Tylor Dr
- 3773 Clearwater Dr
- 4783 Nieles Edge Dr
- 3000 Whitlow Rd
- 5106 Harbor Blvd
- 2901 Renfro Rd
- 3739 Atkinson Rd
- 3330 Dunloe Rd
- 3278 Latonia Rd
- 3314 Dunloe Rd
- 3270 Latonia Rd
- 3287 Latonia Rd
- 3300 Dunloe Rd
- 5308 Deforest Dr
- 3275 Latonia Rd
- 3262 Latonia Rd
- 3262 Latonia Dr
- 3290 Dunloe Rd
- 3323 Dunloe Rd
- 3311 Latonia Rd
- 3317 Dunloe Rd
- 5322 Deforest Dr
- 3253 Latonia Rd
- 3311 Dunloe Rd
- 3254 Latonia Rd
- 5309 Deforest Dr
- 3282 Dunloe Rd