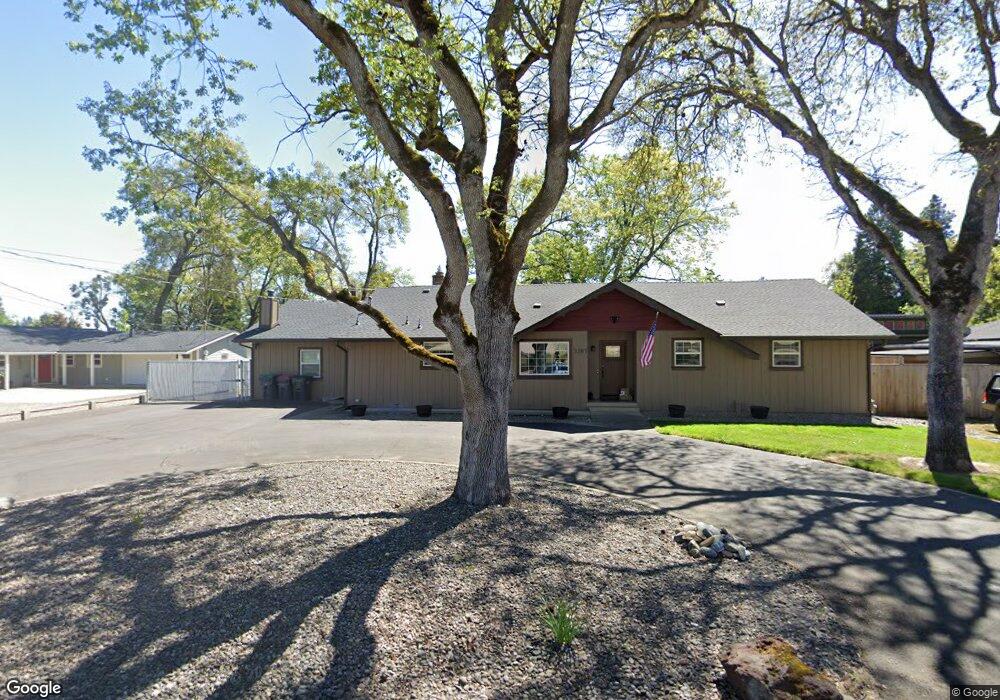
3287 Forest Ave Medford, OR 97501
Estimated Value: $679,462 - $703,000
4
Beds
4
Baths
3,192
Sq Ft
$216/Sq Ft
Est. Value
About This Home
This home is located at 3287 Forest Ave, Medford, OR 97501 and is currently estimated at $688,154, approximately $215 per square foot. 3287 Forest Ave is a home located in Jackson County with nearby schools including Oak Grove Elementary School, McLoughlin Middle School, and South Medford High School.
Ownership History
Date
Name
Owned For
Owner Type
Purchase Details
Closed on
Dec 31, 2020
Sold by
Foxfire Properties Llc
Bought by
Steller Brian Eugene and Steller Kimberly Reneigh
Current Estimated Value
Home Financials for this Owner
Home Financials are based on the most recent Mortgage that was taken out on this home.
Original Mortgage
$517,858
Outstanding Balance
$457,852
Interest Rate
2.7%
Mortgage Type
New Conventional
Estimated Equity
$230,302
Purchase Details
Closed on
Jul 9, 2008
Sold by
Finnicum William W and Finnicum Vicki L
Bought by
Foxfire Properties Llc
Purchase Details
Closed on
Jul 26, 2004
Sold by
Basey Don and Moseley Jean
Bought by
Finnicum William W and Finnicum Vicki L
Purchase Details
Closed on
Oct 9, 2003
Sold by
Miller Raymond Lee and Miller Twyla Ann
Bought by
Basey Don and Moseley Jean
Create a Home Valuation Report for This Property
The Home Valuation Report is an in-depth analysis detailing your home's value as well as a comparison with similar homes in the area
Purchase History
| Date | Buyer | Sale Price | Title Company |
|---|---|---|---|
| Steller Brian Eugene | $382,000 | First American Title | |
| Foxfire Properties Llc | $525,000 | Amerititle | |
| Finnicum William W | $255,000 | First American | |
| Basey Don | $146,000 | -- |
Source: Public Records
Mortgage History
| Date | Status | Borrower | Loan Amount |
|---|---|---|---|
| Open | Steller Brian Eugene | $517,858 |
Source: Public Records
Tax History
| Year | Tax Paid | Tax Assessment Tax Assessment Total Assessment is a certain percentage of the fair market value that is determined by local assessors to be the total taxable value of land and additions on the property. | Land | Improvement |
|---|---|---|---|---|
| 2026 | $4,757 | $407,860 | -- | -- |
| 2025 | $4,666 | $395,990 | $94,690 | $301,300 |
| 2024 | $4,666 | $384,460 | $130,030 | $254,430 |
| 2023 | $4,521 | $373,270 | $126,230 | $247,040 |
| 2022 | $4,416 | $373,270 | $126,230 | $247,040 |
| 2021 | $3,760 | $316,520 | $122,560 | $193,960 |
| 2020 | $3,672 | $307,310 | $118,990 | $188,320 |
| 2019 | $3,589 | $289,670 | $112,160 | $177,510 |
| 2018 | $3,499 | $281,240 | $108,890 | $172,350 |
| 2017 | $3,444 | $281,240 | $108,890 | $172,350 |
| 2016 | $3,455 | $265,100 | $102,650 | $162,450 |
| 2015 | $3,236 | $265,100 | $102,650 | $162,450 |
| 2014 | $3,190 | $249,890 | $96,760 | $153,130 |
Source: Public Records
Map
Nearby Homes
- 408 Oak Grove Rd
- 1019 W Main St
- 341 Englemann Ln
- 221 Cherry Bark Ln
- 2629 Meadows Ln
- 2621 Meadows Ln
- 2613 Meadows Ln
- 206 Darlington St
- 214 Darlington St
- 222 Darlington St
- 2650 Addysen Park Way
- 230 Darlington St
- 2642 Addysen Park Way
- 238 Darlington St
- 826 Oak Grove Rd
- 2626 Addysen Park Way
- 215 Darlington St
- 223 Darlington St
- 231 Darlington St
- 2602 Addysen Park Way
- 3275 Forest Ave
- 3295 Forest Ave
- 3290 W Main St
- 3237 Forest Ave
- 3254 W Main St
- 3300 W Main St
- 3300 W Main St
- 3288 Forest Ave
- 3276 Forest Ave
- 3296 Forest Ave
- 3321 Forest Ave
- 3238 W Main St
- 3238 W Main St
- 3225 Forest Ave
- 3264 Forest Ave
- 3330 W Main St
- 3310 Forest Ave
- 3232 W Main St
- 3335 Forest Ave
- 3224 Forest Ave
Your Personal Tour Guide
Ask me questions while you tour the home.